Euphausiid abundance and size distribution (MOCNESS) from the ARSV Laurence M. Gould LMG0104, LMG0203 from the Southern Ocean, 2001-2002 (SOGLOBEC project)
Project
Program
| Contributors | Affiliation | Role |
|---|---|---|
| Daly, Kendra L. | University of South Florida (USF) | Principal Investigator |
| Copley, Nancy | Woods Hole Oceanographic Institution (WHOI BCO-DMO) | BCO-DMO Data Manager |
Abstract
Euphausiid Abundance, Based on Life Stage and Size
Collected during the Process Cruises, Austral Autumn 2001 and 2002
Data Contributed By:
Kendra L. Daly
College of Marine Science
University of South Florida
140 Seventh Ave. S.
St. Petersburg, FL 33701
Phone: 727-553-1041
E-Mail: kdaly@marine.usf.edu
Net sample collections by: Meng Zhou, Yiwu Zhu, Ryan Dorland, Dan Mertes, and Joe Smith
Sample Analyses by: Jason Zimmerman, Alexander Timonin, Tatjana Semenova
Cruises:
Laurence M. Gould, 23 April - 6 June 2001 (LMG0104 cruise report), 18 net tows
Laurence M Gould, 7 April - 21 May 2002 (LMG0203 cruise report), 16 net tows
Methods
Zooplankton abundance, vertical and horizontal distribution, and population structure were assessed using a 1 m2 Multiple Opening and Closing Nets and Environmental Sampling System (MOCNESS) with nine nets having 333 µm mesh and environmental sensors of temperature, salinity and depth. The entire water column was sampled on the downcast using net # 0, which was not analyzed. The upper water column was typically sampled using nets 1 and 2 from 500 m to 200 m at 150 m depth intervals, nets 3 and 4 from 200 m to 100 m at 50 m depth intervals, and nets 5 to 8 from 100 m to the surface at 25 m depth intervals. Some tows were deployed down to 1000 m, and some tows were towed targeting krill swarms at irregular depths. Approximate locations of process study stations are shown in Fig. 1. More precise locations of the casts in Fig. 2.
Zooplankton samples were immediately preserved in 10% buffered formalin solution. All the large organisms (>15 mm) in the sample were removed and identified to taxa. The sample was then split to about 100 individuals of euphausiids. All euphausiids in the split were identified to species and life history stage and measured for length to the nearest 0.5 mm for larvae and to the nearest 1.0 mm for juvenile and adults. Next the sample was split to about 100 individuals of copepods. Copepods were identified to species and life history stage (female, male, copepodite V, or other copepodite). All other zooplankton in the split were identified to taxa and counted. For the Euchaetidae, we followed the designation of Park (1994) who ascribed the Antarctic species to the genus Paraeuchaeta. This data object ("krill") reports the abundance of each euphausiid species by life stage and size class. The companion data object "zooabund" reports the counts of zooplankton per subsample/split by taxa and life stage or size class.
Further methodology notes [05/07/08] from K. Daly:
My lab started the net sample analyses and we measured lengths of krill to either the nearest 0.25 mm for larvae or to the nearest 0.5 mm for older stages. As I recall, after we sent splits to the Russians to complete the sample analyses, they decided it took too long to do individual measurements and placed larvae into 0.5 mm length groups (3.0-3.4 mm) and the older stages to the nearest 1.0mm. Jason took his original measurements to 0.25mm and placed them in the 0.5 mm intervals used by the Russians. The 0.5 mm length bins (3.0-3.4; 3.5-3.9;) should be the same for all net tows.
For the epibiont and comment information, the occurrence of epibionts was much higher in 2001. This information is useful as a relative measure of percent occurrence. I have seen these cilates before, but they are episodic.
The comments primarily provide information on indirect development. The larvae were placed into a particular life history stage category, but they don't always have the exact number of telson spines, etc., typical of that stage. I reported this information in my 2004 DSR paper.
Greenwich Mean Time was local time + 4 hours.
Fig. 1. Approximate locations of process cruise stations in Marguerite Bay during austral autumn 2001 and 2002.
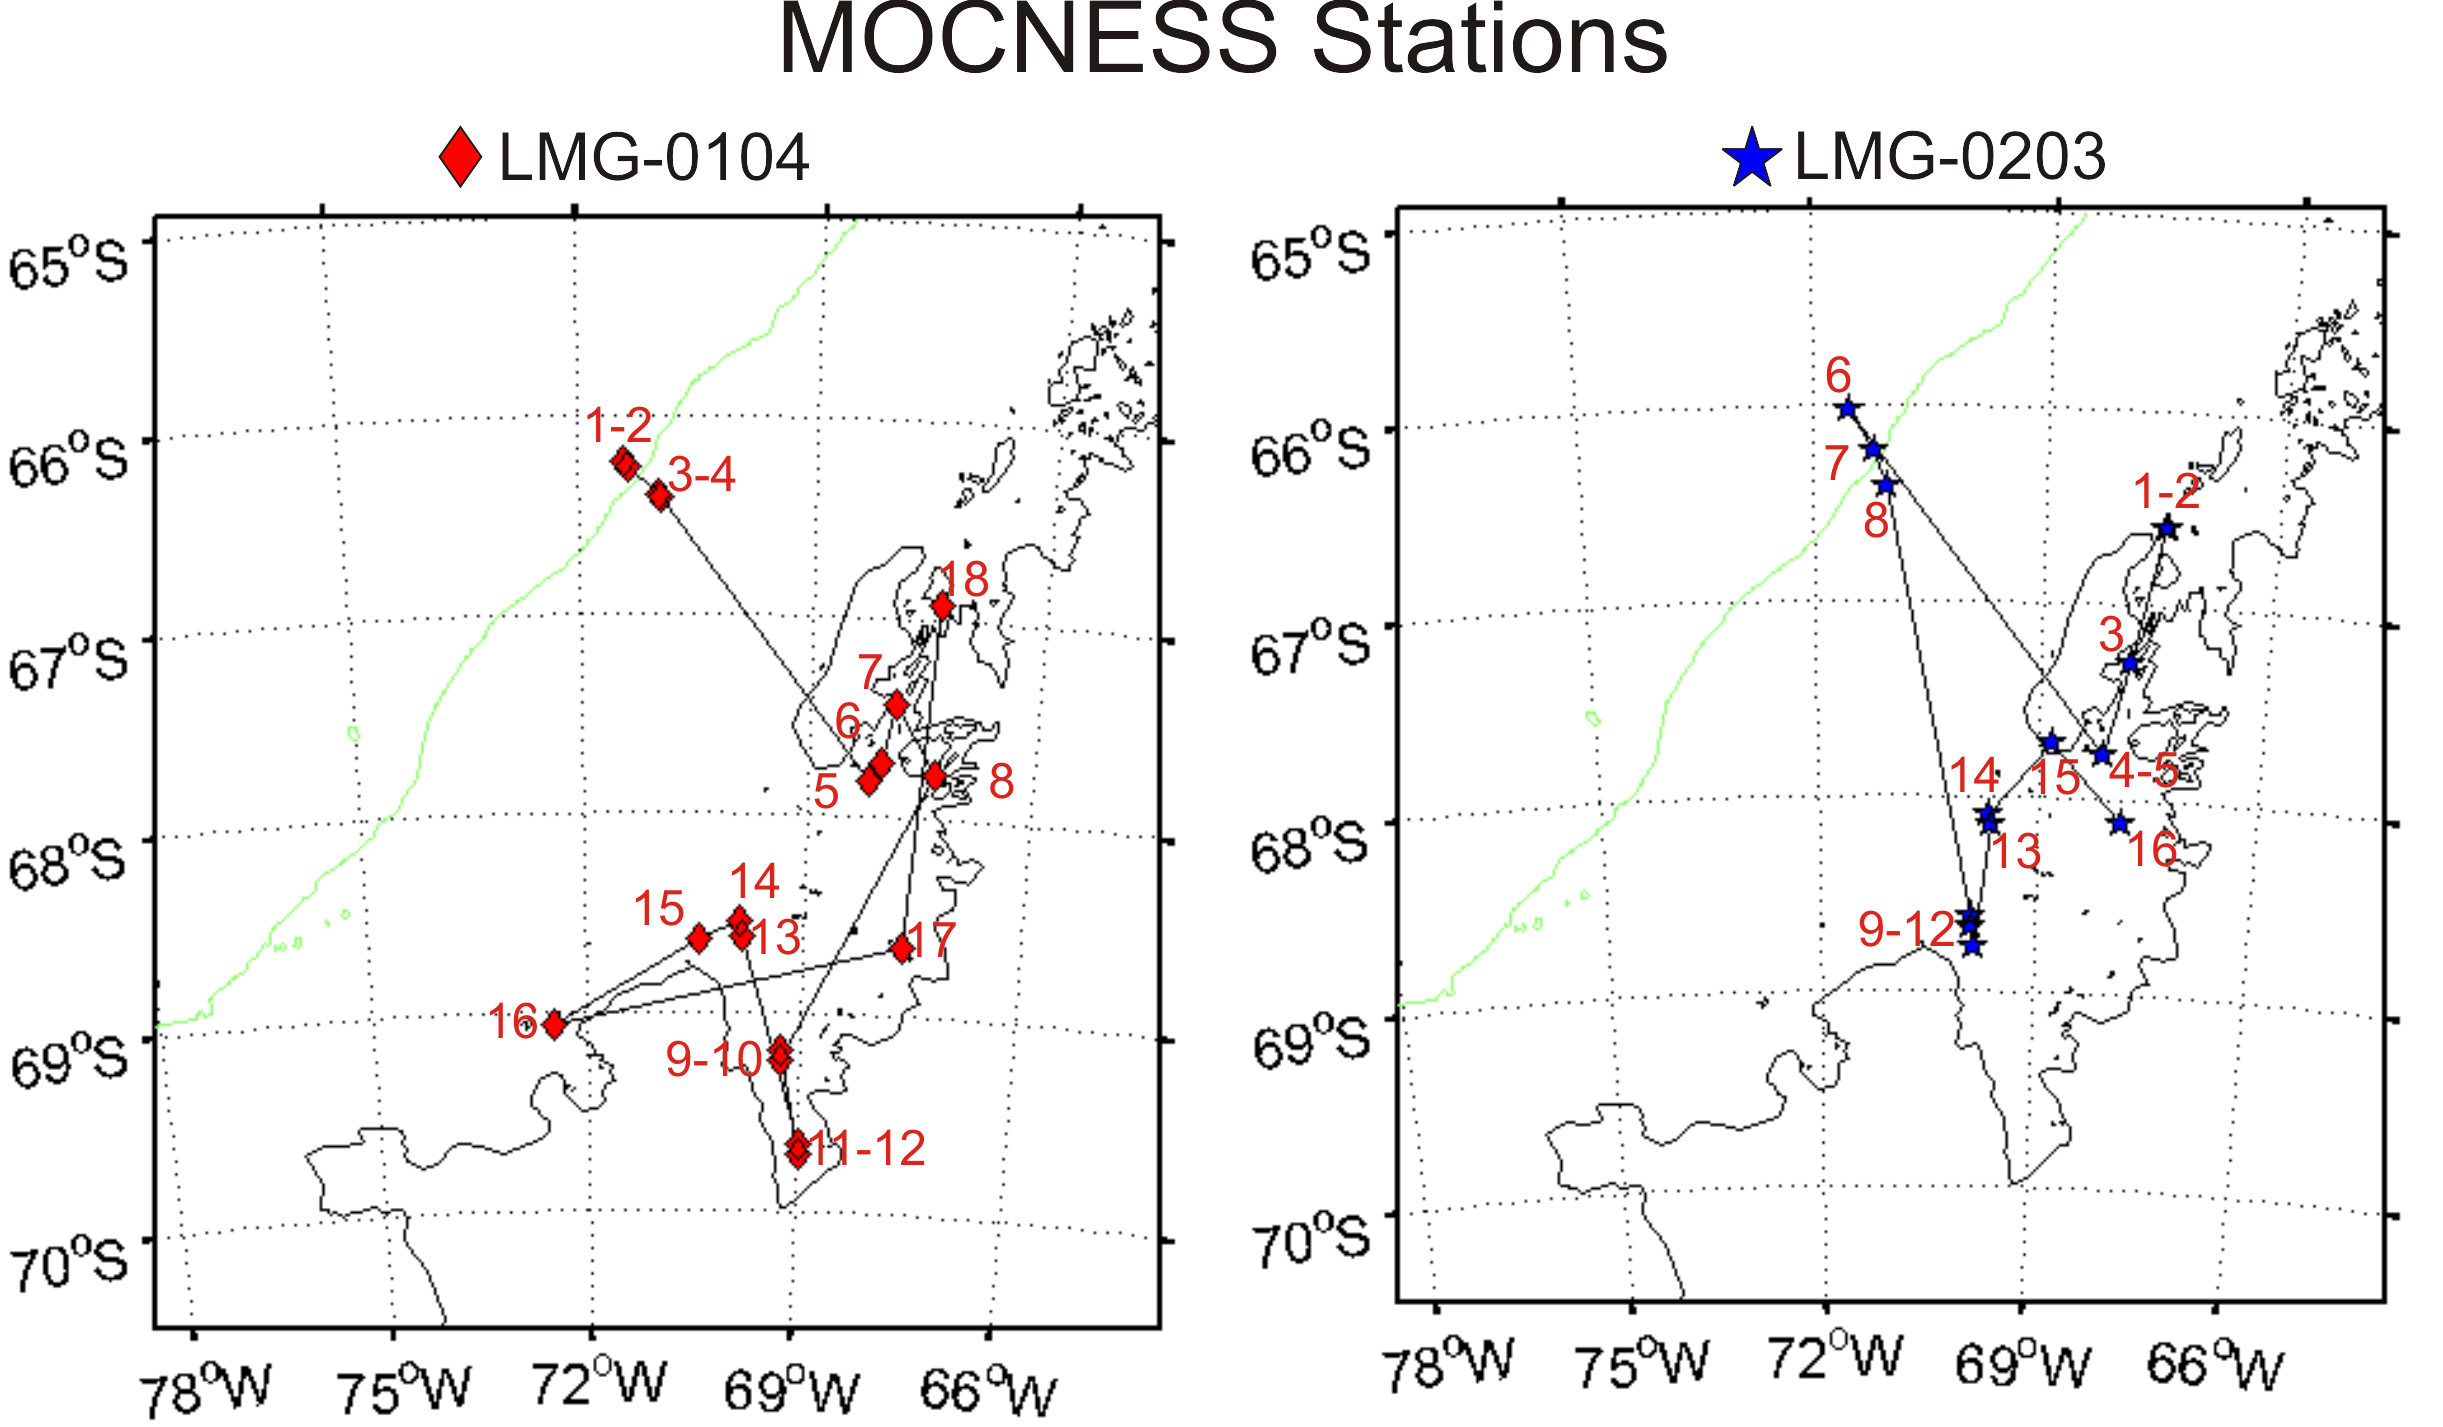
Fig. 2. Locations of MOCNESS stations for LMGould-0104 (2001) and LMGould-0203 (2002) cruises. Numbers correspond to the cast number.
Notes on Volume Filtered values:
The 1 m2 MOCNESS net volume filtered data were corrected for the following net tows:
The flowmeter used to calculate the volume of water filtered did not work for the tows shown below; the data shown in the listings for those tows are therefore derived, not measured. Using the net distance and the average angle of the net, the volume filtered was estimated. These estimates have about a 10% error or higher when currents were present.
2001: No further corrections. MOC-1 net volume filtered values were used to calculate abundance/m3 for all net tows. No Optical Plankton Counter (OPC) volume filtered values were available for 2001.
2002: The flowmeter data was not accurate for some net tows in 2002. Optical Plankton Counter (OPC) volume filtered was used to calculate abundance/m3 for all MOC-1 net tows, except casts 11 and 16 which used the MOC-1 volume filtered values. The decision to use OPC values was determined by plotting all OPC volume filtered numbers versus MOC-1 flow meter data (see below). MOC-1 flow meter data were consistently lower and had a lower R2 regression for volume filtered versus length of tow (time). Meng Zhou and Yiwi Zhu, who conducted the MOC-1 net tows, noted on the haul sheets that there were problems with the MOC-1 flow meters and that they often were not responsive or worked intermittently. Thus, it was decided that the OPC flow meter data provided a more consistent measure of net flow volume for 2002 net tows. The OPC mouth opening for flow meter data was corrected to the MOC-1 net mouth opening by multiplying the OPC flow data by 200. The two casts that used MOC-1 flow meter data were cases where the OPC flow meter data appeared to underestimate the flow.

Fig. 3. Volume filtered over time for both MOCNESS and Optical Plankton Counter showing consistently lower flow rates for the MOCNESS.
DMO Note:
Revised data received Jan. 2008. Reformatted for this data system from Excel spreadsheets, joined with event log metadata (date, lat, lon, depth_w) using 8200 server and restructured using rs 2.0 before serving here. Each individual euphausiid is listed with its length. The abundance for each length bin is given beside the last specimen for that bin. The abundance for the stage and species are shown beside the last specimen of each stage and species, respectively.
Further Data Mgmt. Office Notes [2008-07-07, N. Copley]:
Kendra Daly's updated data for krill, 'K' [https://www.bco-dmo.org/dataset/2366] and zooabund_lmg, 'Z' [https://www.bco-dmo.org/dataset/2386]:
date range of DMO work: 20080318 - 20080801:
2001 data:
- K: changed station 1 to 1A to agree with Z and eventlog.
- station 1A - changed time_local_begin from 500 to 456 to agree with event log.
- Abundance:
2001, sta. 1A, tow1 - no data for this tow was in the previously served data so DMO added it.
2001, sta. 1B, tow3, net4 - abundances were not calculated in the spreadsheet. DMO made the calculations in the file 2001_St1C3_LF.xls page net_7_LF and added them to the data file. - K:
tow 13 and 14 were on 18th; MOC-15 was on 19th, all at station 2.
tow 13 and 14 original datafile lists station as 4 but were changed to station 2 to agree with event log and map (See station map and MOC location map, above).
tow 15 date changed from 18 to 19 to agree with Z and eventlog. - sta. 6, tow 17:
- day_local for K changed from 25 to 27th to agree with revised datafile, Zooabund object, and event log.
- net 8 (surface tow) has counts for Z (no abundance because vol_filt is nd) but not for K:
There are plenty of krill in both files - krill data added from the kdaly file '2001_St7C17_LF.xls'
2002 data:
- tow 3 changed station from 7 to 5 (to match eventlog); dma changed eventlog MOC1-1 station from nd to 7.
- Z: sta.1, tow 7 - date changed from 4/17 to 4/25 and changed station 7 to station 1 on some of the xls pages to agree with eventlog.
- changed sta 1B to 1b to match eventlog (enables join operation with eventlog)
- sta. 1b, tow 8 net 5 sample "Lost at Sea".
- tow 12: different vol_filt for K and Z in served data. Changed both to corrected values.
- Krill: tow 13 net-5 vol_filt corrected from 391 to 591. See Revised_metadata_1mMOC.doc.
- tow 15: sta changed from sta 3 to nd to agree with event log. MOC station map shows MOC-15 is not near station 3.
- Some of the 2002 files were in a different format. The length bins were not listed and therefore counts & abundances of the lengthbins and species were not calculated. DMO added manually.
Notes pertaining to both 2001 and 2002:
- sta. 6, tow 17 net 8 (surface net): has counts but no abundance because vol_filt is nd.
- Added a column in Zooabund called taxon_group which also exists in zooabund_nbp. It has 3 categories: Copepoda, Euphausiacea, and Other_Zooplankton. This somewhat solves Jason's request (email, 3mar04) to be able to look at just the copepods or another group. If one wants to look at something like molluscs, they'll have to subset the data to include all the mollusc taxa (squid, other_gastropods, thecate_pteropods, etc.).
- Z: changed Unidentified_Copepodite to Unidentified_or_Other in order to accomodate species that were identified but on the standard list that are not necessarily copepodites.
- K: Only 5 tows have actual length; the rest have ranges.
split ranges up into two columns (replace hyphen with tab):
changed the length ranges that use commas in place of decimal points to decimals. - DMO added min and max columns for both the bins and the actual lengths since most of the tows don't have lengths, but rather have length ranges which are a smaller range with the length_bin
- DMO added depth_open and depth_close to krill_length object
- Plot off the cast locations created with matlab script.
updated January 6, 2006, gfh
updated July 30, 2008, njc
| File |
|---|
krill.csv (Comma Separated Values (.csv), 2.58 MB) MD5:2b044d2ebc7ee7713f3406228507baa6 Primary data file for dataset ID 2366 |
| Parameter | Description | Units |
| cruiseid | Cruise identifier (LMG0104, LMG0203) | |
| station | Station number | |
| month_local | month of year, local time | |
| day_local | day of month, local time | |
| time_local | Time net tow began, local time, GMT = local time + 4 hrs | HHmm |
| lat | Latitude at beginning of tow, negative = South | decimal degrees |
| lon | Longitude at beginning of tow, negative = West | decimal degrees |
| net | Net number (1-8) | |
| vol_filt | Volume of water filtered by net | meter3 |
| depth_open | Depth each net was opened | meters |
| depth_close | Depth each net was closed | meters |
| taxon | Scientific name of organism or common name of group | |
| stage | Life history stage e.g.: CV = copepodite stage V, C2 = calyptopis stage 2, F2 = furcilia stage 2 | |
| samp_fraction_denom | The sample size represented as a fraction, only the denominator is reported as all samples have been reduced to 1/denominator | |
| year | Year of cruise | |
| cast | Net tow number | |
| depth_w | Depth of the water at specified station | meters |
| month_gmt | month of year, GMT time | |
| day_gmt | day of month, GMT time | |
| time_gmt | Time net tow began, GMT time | |
| lenbin_min | Minimum of length bin range | mm |
| lenbin_max | Maximum of length bin range | mm |
| length_min | Minimum length of individual specimen | mm |
| length_max | Maximum length of individual specimen | mm |
| abund_per_lenbin | Abundance of specimens of a size range described by the length bin min and max. Only the final entry for each bin has the abundance for that bin. Preceeding entries show an abundance of zero (0). | #/m3 |
| count_per_lenbin | the number of animals of specimens of a size range described by the length bin min and max. Only the final entry for each bin has the count for that bin. Preceeding entries show a count of zero (0). | integer |
| count_per_stage | The number of animals of specimens of a stage. Only the final entry for each stage has the count for that stage. Preceeding entries show a count of zero (0). | integer |
| abund_per_stage | Abundance of specimens within a stage and species. Only the final entry for each stage has the abundance for that stage. Preceding entries show an abundance of zero (0). | #/m^3 |
| abundance_species | Abundance of specimens for the species | #/m^3 |
| count_species | Number of specimens within a species for the sample fraction (split) noted | integer |
| epibionts | Comment on presence of epibionts found on the krill specimens | text |
| comments | comments, usually pertaining to the condition or stage of the specimen | |
| inst | Type of instrument used to collect samples: MOC1 is a MOCNESS plankton tow with a 1 meter^2 opening. | unitless |
| Dataset-specific Instrument Name | MOCNESS1 |
| Generic Instrument Name | MOCNESS1 |
| Dataset-specific Description | MOCNESS 1 meter square nets (150 and 335 micrometer mesh) |
| Generic Instrument Description | The Multiple Opening/Closing Net and Environmental Sensing System or MOCNESS is a family of net systems based on the Tucker Trawl principle. The MOCNESS-1 carries nine 1-m2 nets usually of 335 micrometer mesh and is intended for use with the macrozooplankton. All nets are black to reduce contrast with the background. A motor/toggle release assembly is mounted on the top portion of the frame and stainless steel cables with swaged fittings are used to attach the net bar to the toggle release. A stepping motor in a pressure compensated case filled with oil turns the escapement crankshaft of the toggle release which sequentially releases the nets to an open then closed position on command from the surface. -- from the MOCNESS Operations Manual (1999 + 2003). |
LMG0104
| Website | |
| Platform | ARSV Laurence M. Gould |
| Report | |
| Start Date | 2001-04-20 |
| End Date | 2001-06-05 |
LMG0203
| Website | |
| Platform | ARSV Laurence M. Gould |
| Report | |
| Start Date | 2002-04-07 |
| End Date | 2002-05-20 |
U.S. GLOBEC Southern Ocean (SOGLOBEC)
The fundamental objectives of United States Global Ocean Ecosystems Dynamics (U.S. GLOBEC) Program are dependent upon the cooperation of scientists from several disciplines. Physicists, biologists, and chemists must make use of data collected during U.S. GLOBEC field programs to further our understanding of the interplay of physics, biology, and chemistry. Our objectives require quantitative analysis of interdisciplinary data sets and, therefore, data must be exchanged between researchers. To extract the full scientific value, data must be made available to the scientific community on a timely basis.
U.S. GLOBal ocean ECosystems dynamics (U.S. GLOBEC)
U.S. GLOBEC (GLOBal ocean ECosystems dynamics) is a research program organized by oceanographers and fisheries scientists to address the question of how global climate change may affect the abundance and production of animals in the sea.
The U.S. GLOBEC Program currently had major research efforts underway in the Georges Bank / Northwest Atlantic Region, and the Northeast Pacific (with components in the California Current and in the Coastal Gulf of Alaska). U.S. GLOBEC was a major contributor to International GLOBEC efforts in the Southern Ocean and Western Antarctic Peninsula (WAP).
| Funding Source | Award |
|---|---|
| NSF Antarctic Sciences (NSF ANT) |
[ table of contents | back to top ]