Isotope ratios of Pb passing through a 0.2 um Acropak capsule filter from R/V Knorr cruises KN199-04 and KN204-01 in the Subtropical northern Atlantic Ocean in 2010 and 2011 (U.S. GEOTRACES NAT project)
Project
Program
| Contributors | Affiliation | Role |
|---|---|---|
| Boyle, Edward A. | Massachusetts Institute of Technology (MIT-EAPS) | Principal Investigator, Contact |
| Echegoyen-Sanz, Yolanda | Massachusetts Institute of Technology (MIT-EAPS) | Co-Principal Investigator |
| Noble, Abigail | Massachusetts Institute of Technology (MIT-EAPS) | Co-Principal Investigator |
| Rauch, Shannon | Woods Hole Oceanographic Institution (WHOI BCO-DMO) | BCO-DMO Data Manager |
Isotope ratios of Pb from the GEOTRACES North Atlantic Transect. Includes isotope ratios of 206Pb/207Pb, 208Pb/207Pb, and 206Pb/204Pb for Pb passing through a 0.2 um Acropak capsule filter, in nondimensional units.
Sample storage bottle lids and threads were soaked overnight in 2N reagent grade HCl, then filled with 1N reagent grade HCl to be heated in an oven at 60 degrees C overnight, inverted, heated for a second day, and rinsed 5X with pure distilled water. The bottles were then filled with trace metal clean dilute HCl (~0.01N HCl) and again heated in the oven for one day on either end. Clean sample bottles were emptied, and double-bagged prior to rinsing and filling with sample.
Trace metal-clean seawater samples were collected using the U.S. GEOTRACES sampling system consisting of 24 Teflon-coated GO-FLO bottles that had been pre-rinsed with a 24+ hour treatment of filtered surface seawater at the beginning of the cruise (see Cutter & Bruland, 2012 for more information on the sampling system). At each station, the bottles were deployed open and tripped on ascent at 3 m/min. On deck, the bottles were kept in a trace metal clean sampling van over-pressurized with HEPA-filtered air, except immediately prior to and following deployments, in which cases they were covered on both ends with shower caps to avoid deck contamination.
During sampling in the clean van, the GO-FLO bottles were pressurized to ~0.4 atm with HEPA-filtered air, and their spigots were fitted with an acid-cleaned piece of Bev-a-Line tubing that fed into an Acropak-200 Supor capsule filter (0.2 um pore size made of polyethersulfone). Before use, this filter had been filled with filtered surface seawater that had been acidified to pH 2 with trace metal clean HCl and left overnight to rinse. Before collecting any subsamples, at least 500 mL of seawater was passed through the filter (while eliminating air bubbles in the capsule reservoir). Subsamples were taken into acid-cleaned (see above) Nalgene HDPE bottles after a triple rinse with the sample. Acropak filters were used for at most 3 casts before a new filter was used, and they were stored empty in a refrigerator while not in use. GEOFish surface samples were taken using an all-plastic "towed fish" pumping system as described in Bruland et al. 2005 at approximately 3 m depth and were subsampled identically.
All samples were acidified back in the Boyle laboratory at 2 mL per liter seawater (pH ~2) with trace metal clean 6N HCl.
Samples were analyzed at least 1 month after acidification over 9 mass spectrometry sessions by the method of Reuer et al. (2003) as modified by Boyle et al. (2012) and further slightly modified as noted in the following.
Double magnesium hydroxide co-precipitation followed by anion exchange purification:
This method is a slight adaptation of the isotope ratio method of Reuer et al., 2003, which was further modified as described by Boyle et al. (2012) and as slightly revised as described below. The method includes low-blank pre-concentration by Mg(OH)2 co-precipitation and isotope ratio analysis on a GV/Micromass IsoProbe multicollector ICPMS using a 50 uL/min nebulizer aspirated into an APEX/SPIRO desolvator, using post-desolvator trace N2 addition to boost sensitivity.
Nalgene polypropylene separatory funnels (1000mL) and Corning 50 ml conical centrifuge vials were cleaned by heated submersion for 2 days at 60˚C in 1N reagent grade HCl, followed by a bulk rinse and 4X individual rinse of each vial with pure distilled water. Each vial was then filled with trace metal clean dilute HCl (~0.01N HCl) and heated in the oven at 60 degrees C for one day on either end. Centrifuge vials were kept filled until just before usage.
The separatory funnels were rinsed with distilled water after each use and then filled with high-purity distilled water spiked with high-purity HCl (final concentration ~0.01N) between uses.
1000 mL polypropylene separatory funnels (Nalgene) were weighed, rinsed once with seawater sample and filled with 200-500 ml of sample. Mg(OH)2 coprecipitation was induced by minimal addition of high-purity ammonia solution and mixing (typically <12 uL ammonia per 1 mL seawater sample). The separatory funnels were left to settle overnight, then agitated to move the precipitate down the funnel walls. After complete settling, the precipitate was drawn from the bottom of the funnels into a 50 mL conical centrifuge tubes. The solution/precipitate mix was centrifuged and the solution siphoned off, and then the precipitate was dissolved in a minimal amount of high-purity 6N HCl before undergoing another ammonia addition and Mg(OH)2 coprecipitation. The mixture was centrifuged and the overlying solution was siphoned.
Eichrom AG-1x8 resin was cleaned by three batch rinses with 6N trace metal clean HCl for a ~12 hours on a shaker table, followed by multiple washes with distilled water until the pH of the solution was above 4.5. Resin was stored at room temperature in the dark until use.
The precipitate was dissolved in ~1 ml of high purity 1.1M HBr. The amount of solution was adjusted depending on the Si concentration of the seawater sample; if too little solution is used, the Si precipitates as a gel, impeding the column separation. The resin in the column was first cleaned with 6M HCl, equilibrated with 1.1M HBr, and then sample was loaded onto the column. The column was then washed with 1.1M HBr followed by 2M HCl and then eluted with 6M HCl. The samples in a 5 ml Savillex PTFE vial were then taken to dryness on a hotplate in a recirculating filtered air fume hood, and stored sealed until analysis.
Just before analysis, samples were dissolved for several minutes in 0.2M HNO3 and spiked with an appropriate amount of Tl for mass fractionation correction. IsoProbe multicollector ICPMS Faraday cups were used to collect on 202Hg, 203Tl, 205Tl, 206Pb, 207Pb, and 208Pb. An Isotopx Daly detector with a WARP filter was used to collect on 204Pb+204Hg. This Daly detector is a revised version that eliminates a reflection problem with the electronic circuitry of the previous version. We do not report 206Pb/204Pb data for samples run on the old Daly detector. Because the deadtime of the Daly detector varied from day to day, we calibrated deadtime on each day by running a standard with known 206Pb/204Pb at a high 204 count rate. The counter efficiency drifts during the course of a day, so we established that drift by running a standard with known 206Pb/204Pb (and a 204 count rate comparable to the samples) every five samples. Tailing from one Faraday cup to the next was corrected by the 209Bi half-mass method as described by Thirlwall (2000).
On each analytical date, we calibrated the instrument by running NBS981 and normalized measured sample isotope ratios to our measured raw NBS981 isotope ratios to those established by Baker et al. (2004). Using this method for 45 determinations of an in-house standard (BAB) shows that for samples near the upper range of the Pb signals shown for samples (~1V), 206Pb/207Pb and 208Pb/207Pb can be reproduced to ~200ppm. Low-level samples will be worse than that, but generally better than 1000 ppm in this data set. Because of the drift uncertainty in the Daly detector, 206Pb/204Pb for samples in the mid-to-upper range of sample concentrations will be at best reproducible to ~500 ppm.
We have intercalibrated Pb isotope analyses with two labs as reported in Boyle et al. (2012). Since that report, two more labs have added intercalibration data. The outcome of that intercalibration suggests that the accuracy of our measurements approaches the analytical reproducibility we note above.
About 25% of the samples were analyzed by Yolanda Echegoyen, and the other 75% by Abigail Noble.
References:
Baker, J., D. Peate, T. Waight, and C. Meyzena. 2004. Pb isotopic analysis of standards and samples using a 207Pb–204Pb double spike and thallium to correct for mass bias with a double-focusing MC-ICP-MS. Chem. Geol. 211:275-303. doi:10.1016/j.chemgeo.2004.06.030
Boyle, Edward A., Seth John, Wafa Abouchami, Jess F. Adkins, Yolanda Echegoyen-Sanz, Michael Ellwood, Russ Flegal, Kyrstin Fornace, Celine Gallon, Steve Galer, Melanie Gault-Ringold, Francois Lacan, Amandine Radic, Mark Rehkamper, Olivier Rouxel, Yoshiki Sohrin, Claudine Stirling, Claire Thompson, Derek Vance, Zichen Xue, Ye Zhao. 2012. GEOTRACES IC1 (BATS) Contamination-Prone Trace Element Isotopes Cd, Fe, Pb, Zn, (and Mo) Intercalibration, Limnol. Oceanogr. Methods 10:653-665. doi:10.4319/lom.2012.10.653
Reuer, M.K., Boyle, E.A., Grant, B.A. 2003. Lead isotope analysis of marine carbonates and seawater by multiple collector ICP-MS. Chemical Geology 200: 137-153. doi:10.1016/S0009-2541(03)00186-4
Thirlwall, M.F., 2001. Inappropriate tail corrections can cause large inaccuracy in isotope ratio determination by MC-ICP- MS. J. Anal. At. Spectrom. 16, 1121–1125. doi:10.1039/B103828C
During the isotope ratio analysis, the data were collected in 20 cycles. The isotope ratios were edited for outliers, and averaged with standard errors estimated from the multiple cycles. The standard Ocean Data View flags were used (reference all flags at https://www.bodc.ac.uk/data/codes_and_formats/odv_format/):
1: Good Value: Good quality data value that is not part of any identified malfunction and has been verified as consistent with real phenomena during the quality control process.
2: Probably Good Value: Data value that is probably consistent with real phenomena but this is unconfirmed or data value forming part of a malfunction that is considered too small to affect the overall quality of the data object of which it is a part. [Used when only one replicate confirmed the reported value.]
3: Probably Bad Value: Data value recognized as unusual during quality control that forms part of a feature that is probably inconsistent with real phenomena.
4: Bad Value: An obviously erroneous data value.
9: Missing Value: The data value is missing. That usually applies only to 206Pb/204Pb samples analyzed by the pre-updated Daly detector.
In this data set, we encounter any samples that did not yield acceptably reproducible results upon repeated analysis. However, there were a few points that fall off of the depth profiles based on adjacent samples and for which an obvious hydrographic argument could not be made for the anomaly. These samples may be contaminated, and they are given the quality control flag of 3 (probably bad value).
BCO-DMO edits:
- modified parameter names to conform with BCO-DMO naming conventions;
- replace original cruise id's with standard cruise id's;
- added column for cruise_part (legs a and b) and separated for KN204-01;
- replaced blanks (missing data) with 'nd' (no data);
- 26 July 2016: replaced original version of dataset with updated/revised data from E. Boyle (received July 2016);
- 21 Nov 2016: made correction to fix duplicate sample numbers per correspondence with PI.
Additional GEOTRACES Processing:
After the data were submitted to the International Data Management Office, BODC, the office noticed us that important identifying information was missing in many datasets. With the agreement of BODC and the US GEOTRACES lead PIs, BCO-DMO added standard US GEOTRACES information, such as the US GEOTRACES event number, to each submitted dataset lacking this information. To accomplish this, BCO-DMO compiled a 'master' dataset composed of the following parameters: station_GEOTRC, cast_GEOTRC (bottle and pump data only), event_GEOTRC, sample_GEOTRC, sample_bottle_GEOTRC (bottle data only), bottle_GEOTRC (bottle data only), depth_GEOTRC_CTD (bottle data only), depth_GEOTRC_CTD_rounded (bottle data only), BTL_ISO_DateTime_UTC (bottle data only), and GeoFish_id (GeoFish data only). This added information will facilitate subsequent analysis and inter comparison of the datasets.
Bottle parameters in the master file were taken from the GT-C_Bottle_GT10, GT-C_Bottle_GT11, ODF_Bottle_GT10, and ODF_Bottle_GT11 datasets. Non-bottle parameters, including those from GeoFish tows, Aerosol sampling, and McLane Pumps, were taken from the Event_Log_GT10 and Event_Log_GT11 datasets. McLane pump cast numbers missing in event logs were taken from the Particulate Th-234 dataset submitted by Ken Buesseler.
A standardized BCO-DMO method (called "join") was then used to merge the missing parameters to each US GEOTRACES dataset, most often by matching on sample_GEOTRC or on some unique combination of other parameters.
If the master parameters were included in the original data file and the values did not differ from the master file, the original data columns were retained and the names of the parameters were changed from the PI-submitted names to the standardized master names. If there were differences between the PI-supplied parameter values and those in the master file, both columns were retained. If the original data submission included all of the master parameters, no additional columns were added, but parameter names were modified to match the naming conventions of the master file.
See the dataset parameters documentation for a description of which parameters were supplied by the PI and which were added via the join method.
| File |
|---|
Pb_isotopes_GT10-11_joined.csv (Comma Separated Values (.csv), 50.21 KB) MD5:e29532b1c58b9d76c6de323a285f121e Primary data file for dataset ID 644765 |
| Parameter | Description | Units |
| cruise_id | Official cruise identifier e.g. KN199-04 = R/V Knorr cruise number 199-04. | dimensionless |
| EXPOCODE | Cruise EXPOCODE. | dimensionless |
| SECT_ID | Alternate cruise identifier. | dimensionless |
| station_GEOTRC | GEOTRACES station number; ranges from 1 through 12 for KN199-04 and 1 through 24 for KN204-01. Stations 7 and 9 were skipped on KN204-01. Some GeoFish stations are denoted as X_to_Y indicating the tow occurred between stations X and Y. Values were added from the intermediate US GEOTRACES master file (see Processing Description). | dimensionless |
| cruise_part | Cruise leg (a or b); applies to KN204-01 only. | dimensionless |
| event_GEOTRC | Unique identifying number for US GEOTRACES sampling events; ranges from 2001 to 2225 for KN199-04 events and from 3001 to 3282 for KN204-01 events. Values were added from the intermediate US GEOTRACES master file (see Processing Description). | dimensionless |
| cast_GEOTRC | Cast identifier numbered consecutively within a station. Values were added from the intermediate US GEOTRACES master file (see Processing Description). | dimensionless |
| date | Date (4-digit year, 2-digit month, 2-digit day); provided by the PI. | YYYYmmdd |
| time | Time (2-digit hour, 2-digit minute); provided by the PI. | HHMM |
| lat | Latitude; provided by the PI. | decimal degrees |
| lon | Longitude; provided by the PI. | decimal degrees |
| sample_GEOTRC | Unique identifying number for US GEOTRACES samples; ranges from 5033 to 6078 for KN199-04 and from 6112 to 8148 for KN204-01. PI-supplied values were identical to those in the intermediate US GEOTRACES master file. | dimensionless |
| CTDPRS | CTD pressure; provided by the PI. | decibars |
| depth | Depth; provided by the PI. | meters |
| Pb_206_TO_Pb_207_D_CONC_BOTTLE | Dissolved isotope ratio of 206Pb/207Pb; samples collected by GT-C rosette. | dimensionless |
| Pb_206_TO_Pb_207_D_CONC_FISH | Dissolved isotope ratio of 206Pb/207Pb; samples collected by GeoFish. | dimensionless |
| Pb_208_TO_Pb_207_D_CONC_BOTTLE | Dissolved isotope ratio of 208Pb/207Pb; samples collected by GT-C rosette. | dimensionless |
| Pb_208_TO_Pb_207_D_CONC_FISH | Dissolved isotope ratio of 208Pb/207Pb; samples collected by GeoFish. | dimensionless |
| Pb_206_TO_Pb_204_D_CONC_BOTTLE | Dissolved isotope ratio of 206Pb/204Pb; samples collected by GT-C rosette. | dimensionless |
| Pb_206_TO_Pb_204_D_CONC_FISH | Dissolved isotope ratio of 206Pb/204Pb; samples collected by GeoFish. | dimensionless |
| Pb_ISOTOPE_FLAG_W | Quality flag. See "Processing Description" for definitions. | dimensionless |
| BTLNBR_FLAG_W | Bottle flag; follows WOCE bottle flag conventions. | dimensionless |
| sample_bottle_GEOTRC | Unique identifying number for US GEOTRACES samples; ranges from 5033 to 6078 for KN199-04 and from 6112 to 8148 for KN204-01. Values were added from the intermediate US GEOTRACES master file (see Processing Description). | dimensionless |
| bottle_GEOTRC | Alphanumeric characters identifying bottle type (e.g. NIS representing Niskin and GF representing GOFLO) and position on a CTD rosette. PI-supplied values were identical to those in the intermediate US GEOTRACES master file. Values were added from the intermediate US GEOTRACES master file (see Processing Description). | dimensionless |
| depth_GEOTRC_CTD | Observation/sample depth in meters; calculated from CTD pressure. Values were added from the intermediate US GEOTRACES master file (see Processing Description). | meters |
| instr | Sampling instrument; according to the event log. | dimensionless |
| BTL_ISO_DateTime_UTC | Date and time (UTC) variable recorded at the bottle sampling time in ISO compliant format. Values were added from the intermediate US GEOTRACES master file (see Processing Description). This standard is based on ISO 8601:2004(E) and takes on the following form: 2009-08-30T14:05:00[.xx]Z (UTC time) | YYYY-MM-DDTHH:MM:SS[.xx][+/-TZ] |
| Dataset-specific Instrument Name | ICPMS |
| Generic Instrument Name | Inductively Coupled Plasma Mass Spectrometer |
| Generic Instrument Description | An ICP Mass Spec is an instrument that passes nebulized samples into an inductively-coupled gas plasma (8-10000 K) where they are atomized and ionized. Ions of specific mass-to-charge ratios are quantified in a quadrupole mass spectrometer. |
| Dataset-specific Instrument Name | Teflon-coated GO-FLO bottles |
| Generic Instrument Name | GO-FLO Teflon Trace Metal Bottle |
| Generic Instrument Description | GO-FLO Teflon-lined Trace Metal free sampling bottles are used for collecting water samples for trace metal, nutrient and pigment analysis. The GO-FLO sampling bottle is designed specifically to avoid sample contamination at the surface, internal spring contamination, loss of sample on deck (internal seals), and exchange of water from different depths. |
| Dataset-specific Instrument Name | GEOFish |
| Generic Instrument Name | GeoFish Towed near-Surface Sampler |
| Generic Instrument Description | The GeoFish towed sampler is a custom designed near surface ( |
KN199-04
| Website | |
| Platform | R/V Knorr |
| Report | |
| Start Date | 2010-10-15 |
| End Date | 2010-11-04 |
| Description | This cruise constitutes the first survey section as part of the U.S. participation in an international program named GEOTRACES.
Funding: NSF OCE award 0926423
Science Objectives: To obtain state of the art trace metal and isotope measurements on a suite of samples taken on a mid-latitude zonal transect of the North Atlantic. In particular, sampling targeted the oxygen minimum zone extending off the west African coast near Mauritania, the TAG hydrothermal field, and the western boundary current system along Line W. For additional information, please refer to the GEOTRACES program Web site (https://www.geotraces.org/) for overall program objectives and a summary of properties measured.
Science Activities include seawater sampling via GoFLO and Niskin carousels, in situ pumping (and filtration), CTDO2 and transmissometer sensors, underway pumped sampling of surface waters, and collection of aerosols and rain. Hydrography, CTD and nutrient measurements were supported by the Ocean Data Facility (J. Swift) at Scripps Institution of Oceanography and funded through NSF Facilities. They provided an additional CTD rosette system along with nephelometer and LADCP. A trace metal clean Go-Flo Rosette and winch were provided by the group at Old Dominion University (G. Cutter) along with a towed underway pumping system.
Additional cruise information is available from the Rolling Deck to Repository (R2R): https://www.rvdata.us/search/cruise/KN199-04
Other Relevant Links:
List of cruise participants: [ PDF ]
Cruise track: JPEG image (from Woods Hole Oceanographic Institution, vessel operator)
ADCP data are available from the Currents ADCP group at the University of Hawaii: KN199-04 ADCP |
KN204-01
| Website | |
| Platform | R/V Knorr |
| Report | |
| Start Date | 2011-11-06 |
| End Date | 2011-12-11 |
| Description | The US GEOTRACES North Atlantic cruise aboard the R/V Knorr completed the section between Lisbon and Woods Hole that began in October 2010 but was rescheduled for November-December 2011. The R/V Knorr made a brief stop in Bermuda to exchange samples and personnel before continuing across the basin. Scientists disembarked in Praia, Cape Verde, on 11 December. The cruise was identified as KN204-01A (first part before Bermuda) and KN204-01B (after the Bermuda stop). However, the official deployment name for this cruise is KN204-01 and includes both part A and B.
Science activities included: ODF 30 liter rosette CTD casts, ODU Trace metal rosette CTD casts, McLane particulate pump casts, underway sampling with towed fish and sampling from the shipboard "uncontaminated" flow-through system.
Full depth stations are shown in the accompanying figure (see below). Additional stations to sample for selected trace metals to a depth of 1000 m are not shown. Standard stations are shown in red (as are the ports) and "super" stations, with extra casts to provide large-volume samples for selected parameters, are shown in green.
Station spacing is concentrated along the western margin to evaluate the transport of trace elements and isotopes by western boundary currents. Stations across the gyre will allow scientists to examine trace element supply by Saharan dust, while also contrasting trace element and isotope distributions in the oligotrophic gyre with conditions near biologically productive ocean margins, both in the west, to be sampled now, and within the eastern boundary upwelling system off Mauritania, sampled last year.
Funding: The cruise was funded by NSF OCE awards 0926204, 0926433 and 0926659.
Additional cruise information is available from the Rolling Deck to Repository (R2R): https://www.rvdata.us/search/cruise/KN204-01
Other Relevant Links:
ADCP data are available from the Currents ADCP group at the University of Hawaii at the links below:KN204-01A (part 1 of 2011 cruise; Woods Hole, MA to Bermuda)KN204-01B (part 2 of 2011 cruise; Bermuda to Cape Verde) |
U.S. GEOTRACES North Atlantic Transect (GA03) (U.S. GEOTRACES NAT)
Much of this text appeared in an article published in OCB News, October 2008, by the OCB Project Office.
The first U.S. GEOTRACES Atlantic Section will be specifically centered around a sampling cruise to be carried out in the North Atlantic in 2010. Ed Boyle (MIT) and Bill Jenkins (WHOI) organized a three-day planning workshop that was held September 22-24, 2008 at the Woods Hole Oceanographic Institution. The main goal of the workshop, sponsored by the National Science Foundation and the U.S. GEOTRACES Scientific Steering Committee, was to design the implementation plan for the first U.S. GEOTRACES Atlantic Section. The primary cruise design motivation was to improve knowledge of the sources, sinks and internal cycling of Trace Elements and their Isotopes (TEIs) by studying their distributions along a section in the North Atlantic (Figure 1). The North Atlantic has the full suite of processes that affect TEIs, including strong meridional advection, boundary scavenging and source effects, aeolian deposition, and the salty Mediterranean Outflow. The North Atlantic is particularly important as it lies at the "origin" of the global Meridional Overturning Circulation.
It is well understood that many trace metals play important roles in biogeochemical processes and the carbon cycle, yet very little is known about their large-scale distributions and the regional scale processes that affect them. Recent advances in sampling and analytical techniques, along with advances in our understanding of their roles in enzymatic and catalytic processes in the open ocean provide a natural opportunity to make substantial advances in our understanding of these important elements. Moreover, we are motivated by the prospect of global change and the need to understand the present and future workings of the ocean's biogeochemistry. The GEOTRACES strategy is to measure a broad suite of TEIs to constrain the critical biogeochemical processes that influence their distributions. In addition to these "exotic" substances, more traditional properties, including macronutrients (at micromolar and nanomolar levels), CTD, bio-optical parameters, and carbon system characteristics will be measured. The cruise starts at Line W, a repeat hydrographic section southeast of Cape Cod, extends to Bermuda and subsequently through the North Atlantic oligotrophic subtropical gyre, then transects into the African coast in the northern limb of the coastal upwelling region. From there, the cruise goes northward into the Mediterranean outflow. The station locations shown on the map are for the "fulldepth TEI" stations, and constitute approximately half of the stations to be ultimately occupied.
Figure 1. The proposed 2010 Atlantic GEOTRACES cruise track plotted on dissolved oxygen at 400 m depth. Data from the World Ocean Atlas (Levitus et al., 2005) were plotted using Ocean Data View (courtesy Reiner Schlitzer). [click on the image to view a larger version]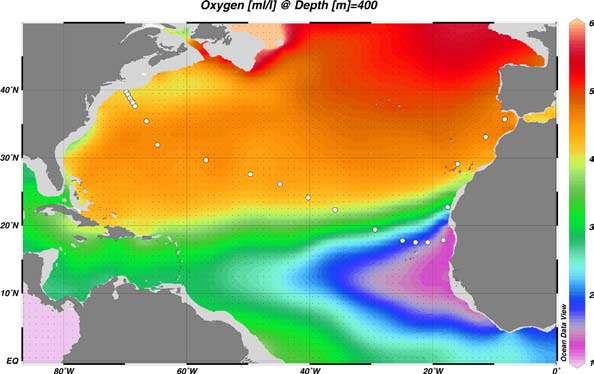
Hydrography, CTD and nutrient measurements will be supported by the Ocean Data Facility (J. Swift) at Scripps Institution of Oceanography and funded through NSF Facilities. They will be providing an additional CTD rosette system along with nephelometer and LADCP. A trace metal clean Go-Flo Rosette and winch will be provided by the group at Old Dominion University (G. Cutter) along with a towed underway pumping system.
The North Atlantic Transect cruise began in 2010 with KN199 leg 4 (station sampling) and leg 5 (underway sampling only) (Figure 2).
Figure 2. The red line shows the cruise track for the first leg of the US Geotraces North Atlantic Transect on the R/V Knorr in October 2010. The rest of the stations (beginning with 13) will be completed in October-December 2011 on the R/V Knorr (courtesy of Bill Jenkins, Chief Scientist, GNAT first leg). [click on the image to view a larger version]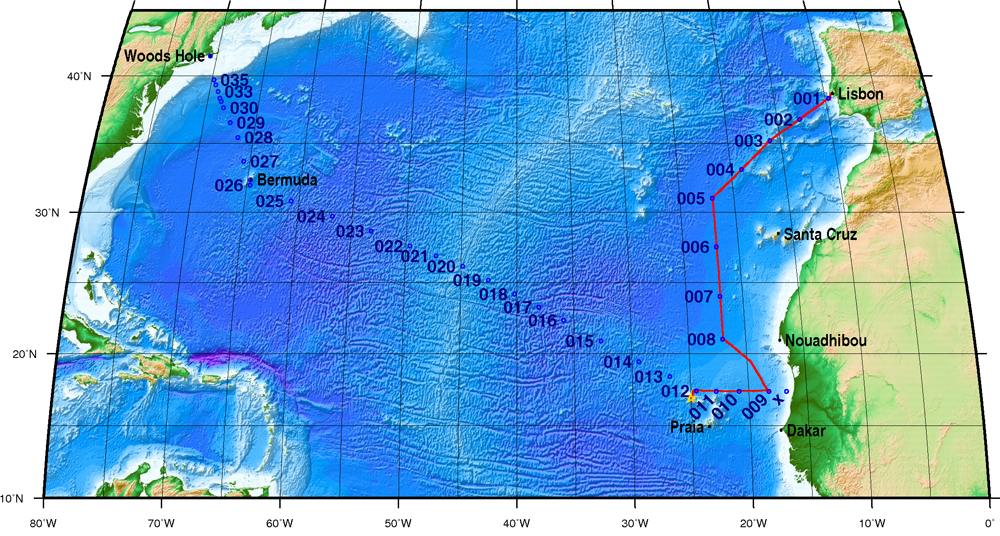
The section completion effort resumed again in November 2011 with KN204-01A,B (Figure 3).
KN204-01A,B Cruise Report (PDF)
Figure 3. Station locations occupied on the US Geotraces North Atlantic Transect on the R/V Knorr in November 2011. [click on the image to view a larger version]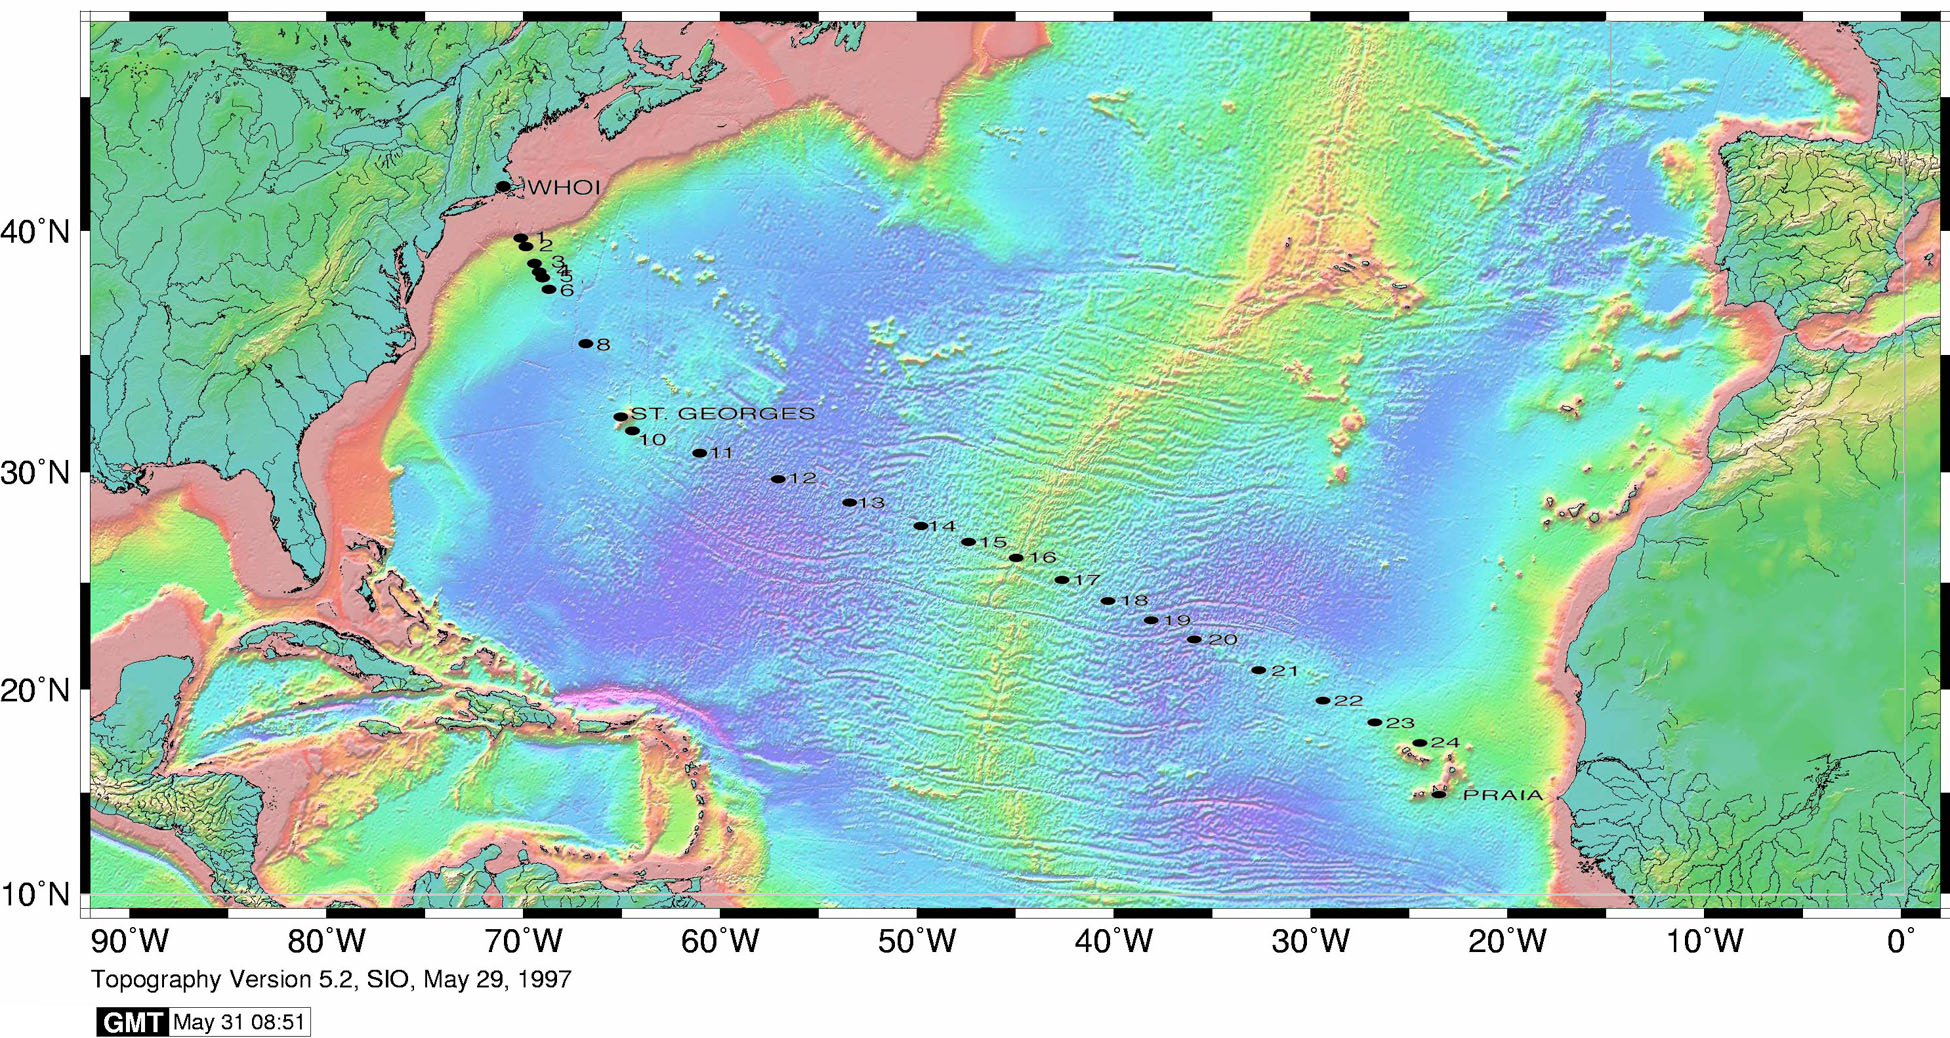
Data from the North Atlantic Transect cruises are available under the Datasets heading below, and consensus values for the SAFe and North Atlantic GEOTRACES Reference Seawater Samples are available from the GEOTRACES Program Office: Standards and Reference Materials
ADCP data are available from the Currents ADCP group at the University of Hawaii at the links below:
KN199-04 (leg 1 of 2010 cruise; Lisbon to Cape Verde)
KN199-05 (leg 2 of 2010 cruise; Cape Verde to Charleston, NC)
KN204-01A (part 1 of 2011 cruise; Woods Hole, MA to Bermuda)
KN204-01B (part 2 of 2011 cruise; Bermuda to Cape Verde)
U.S. GEOTRACES (U.S. GEOTRACES)
GEOTRACES is a SCOR sponsored program; and funding for program infrastructure development is provided by the U.S. National Science Foundation.
GEOTRACES gained momentum following a special symposium, S02: Biogeochemical cycling of trace elements and isotopes in the ocean and applications to constrain contemporary marine processes (GEOSECS II), at a 2003 Goldschmidt meeting convened in Japan. The GEOSECS II acronym referred to the Geochemical Ocean Section Studies To determine full water column distributions of selected trace elements and isotopes, including their concentration, chemical speciation, and physical form, along a sufficient number of sections in each ocean basin to establish the principal relationships between these distributions and with more traditional hydrographic parameters;
* To evaluate the sources, sinks, and internal cycling of these species and thereby characterize more completely the physical, chemical and biological processes regulating their distributions, and the sensitivity of these processes to global change; and
* To understand the processes that control the concentrations of geochemical species used for proxies of the past environment, both in the water column and in the substrates that reflect the water column.
GEOTRACES will be global in scope, consisting of ocean sections complemented by regional process studies. Sections and process studies will combine fieldwork, laboratory experiments and modelling. Beyond realizing the scientific objectives identified above, a natural outcome of this work will be to build a community of marine scientists who understand the processes regulating trace element cycles sufficiently well to exploit this knowledge reliably in future interdisciplinary studies.
Expand "Projects" below for information about and data resulting from individual US GEOTRACES research projects.
| Funding Source | Award |
|---|---|
| NSF Division of Ocean Sciences (NSF OCE) |
[ table of contents | back to top ]