Zooplankton abundance and biomass from MOCNESS silhouettes, from the RVIB Nathaniel B. Palmer NBP0103, NBP0104 from the Southern Ocean, 2001-2002 (SOGLOBEC project, Southern Ocean Krill project)
Project
Programs
| Contributors | Affiliation | Role |
|---|---|---|
| Ashjian, Carin J. | Woods Hole Oceanographic Institution (WHOI) | Principal Investigator |
| Wiebe, Peter H. | Woods Hole Oceanographic Institution (WHOI) | Principal Investigator |
| Copley, Nancy | Woods Hole Oceanographic Institution (WHOI) | Technician, BCO-DMO Data Manager |
Abstract
Zooplankton abundance and biomass from MOCNESS nets using silhouette analysis NB Palmer, austral fall & winter of 2001 & 2002
Cruises:
Nathaniel B. Palmer, April-June 2001 (NBP01-03), 24 tows
Nathaniel B. Palmer, July-Sept. 2001 (NBP01-04), 17 tows
Nathaniel B. Palmer, April-May 2002 (NBP02-02), 24 tows
Nathaniel B. Palmer, July-Sept. 2002 (NBP02-04), 19 tows
Related Datasets:
Zooplankton biovolume values from MOCNESS tows - this data set is derived from displacement volume measurements and dry weight conversion calculations from the same set of samples as the above data. https://www.bco-dmo.org/dataset/2372
Zooplankton Abundance Based on Taxa and Life Stages or Size - these abundance values on the same tows were derived by counting and identifying a subset of the zooplankton to the species and life stage for euphausiids and dominant copepods and to taxonomic group with broad size categories for other zooplankton (pteropod, chaetognath, polychaete, etc.). https://www.bco-dmo.org/dataset/2387
The MOCNESS-1 plankton sampler has nine rectangular nets (1m x 1.4 m) with a mesh size of 0.333 mm, which are opened and closed sequentially by commands through conducting cable from the surface (Wiebe et al., 1976).
Biomass (wet weight) and abundance were determined principally by silhouette digitization of taxa lengths and conversion to equivalent wet weights according to the equations and methods adapted from Davis and Wiebe (1985) and Wiebe et al. (2004). New formulas were calculated for Southern Ocean krill because the length-weight relationship (Wet Weight = 0.0054*Length3.214) differed from that of the North Atlantic euphausiids (Wet Weight = 0.0138*Length3.071; Davis and Wiebe, 1985).
MOCNESS Sample Analysis (from Ashjian et al., 2004)
Silhouette photographs first were obtained from each sample; this photograph then was scanned with an Epson Expression 1600 scanner at 1200 dpi to produce a Tagged Image File Format (TIF) image. Identification and measurement of organisms from the tiff image were accomplished manually using the specialized MATLAB (Mathworks, Inc.) routine, the WHOI Silhouette DIGITIZER (v 1.0) (Little and Copley, 2003). A scanned photographic image of an aliquot of a sample was displayed with a superimposed reference grid on the computer screen. The operator identified each organism to taxonomic and/or size category by selecting the appropriate category button. Organism lengths (both straight and curved) then were measured by the operator using the cursor on the computer screen. Although the nominal resolution of the measurement is 0.02 mm, in practice the resolution was ~0.05 mm. In instances where there were too many organisms of a given type to justify measuring every individual organism, the DIGITIZER routine generated a list of randomly located cells to systematically sub-sample the overall image. Each organism's biomass was calculated automatically from its length measurement using the appropriate length-weight relationship.
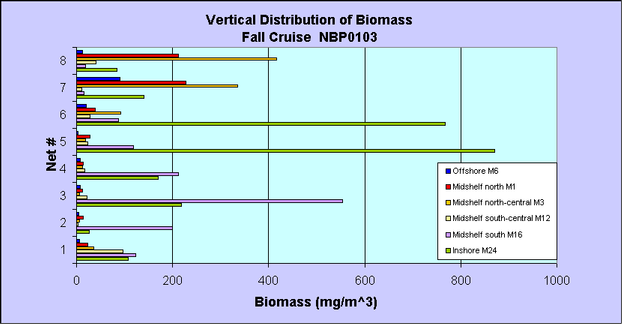
This is a graph of the vertical distribution of biomass from the Winter 2001 Cruise, NBP0103. Net 8 is closest to the surface and net 1 is deepest:
This is a graph of the vertical distribution of biomass from the Winter 2001 Cruise, NBP0104:
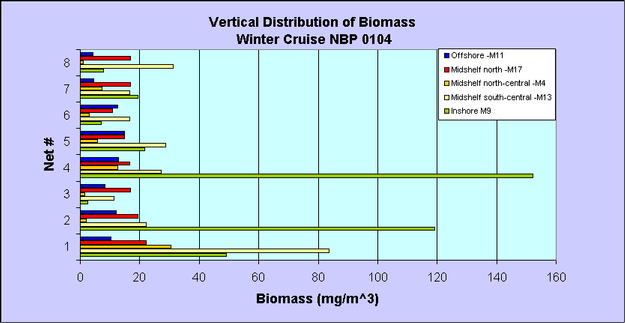
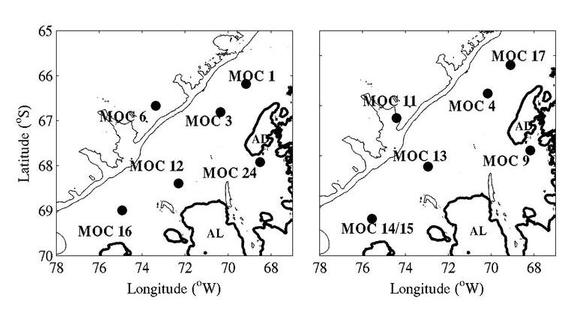
Figure 1. Map of Tow locations, Fall and Winter, 2001
Table 1. Summary of locations, times, and depths for the twelve net tows.
(Note: Winter tows 14 and 15 were considered one tow because when ice and malfunction led to no data in the top three nets of Tow 14, MOC Tow 15 was fished in the upper 90 meters to compensate.)
| Cruise | Region | Tow Number |
Date | Time (Local) |
Light* | Lat(S) | Lon(W) | Tow Depth(m) | Bottom Depth(m) | Ice Cover (tenths) |
|---|---|---|---|---|---|---|---|---|---|---|
| Fall | Offshore | 6 | 05/04/01 | 1332 | D | 66 40.17 | 73 22.08 | 0-1001 | 3650 | 0 |
| Midshelf 1 | 1 | 04/30/01 | 2050 | N | 66 10.80 | 69 10.47 | 0-306 | 360 | 0 | |
| Midshelf 2 | 3 | 05/02/01 | 0320 | N | 66 48.53 | 70 21.42 | 0-348 | 600 | 0 | |
| Midshelf 3 | 12 | 05/13/01 | 1830 | N | 68 23.62 | 72 18.44 | 0-356 | 400 | 0 | |
| Midshelf 4 | 16 | 05/18/01 | 0854 | N | 68 59.43 | 74 55.77 | 0-340 | 350 | 0 | |
| Marguerite Bay | 24 | 05/29/01 | 0300 | N | 67 55.33 | 68 30.69 | 0-602 | 690 | 0 | |
| Winter | Offshore | 11 | 08/11/01 | 0918 | T | 67 14.69 | 74 25.27 | 0-989 | 2917 | 10 |
| Midshelf 1 | 17 | 08/26/01 | 0306 | N | 66 11.13 | 69 06.21 | 7-305 | 346 | 6 | |
| Midshelf 2 | 4 | 07/31/01 | 0949 | D | 66 45.18 | 70 09.64 | 11-413 | 501 | 8 | |
| Midshelf 3 | 13 | 08/17/01 | 2117 | N | 68 13.21 | 72 56.53 | 0-230 | 325 | 10 | |
| Midshelf 4 | 14 | 08/21/01 | 1136 | D | 69 15.55 | 75 34.00 | 20-290 | ~340 | 7 | |
| 15 | 08/22/01 | 0327 | N | 69 12.30 | 75 43.90 | 0-91 | ~350 | 9 | ||
| Marguerite Bay | 9 | 08/08/01 | 0215 | N | 67 53.74 | 68 10.82 | 0-488 | 600+ | 9 |
*Light conditions are designated as:
"D" = day, sunlight present;
"N" = night, darkness;
"T" = twilight
| File |
|---|
zoo_moc.csv (Comma Separated Values (.csv), 430.33 KB) MD5:939981ce72fda85d87374a61efb471c4 Primary data file for dataset ID 2389 |
| Parameter | Description | Units |
| cruiseid | Cruise Identifier (e.g., LMG0103, NPB0104) | |
| year | year of cruise | |
| tow | tow number | |
| lat | latitude, negative = South | decimal degrees |
| lon | longitude, negative = West | decimal degrees |
| depth_w | depth of water at the start of tow | meters |
| net | net number (0-8) | |
| depth_open | depth where net is opened | meters |
| depth_close | depth where net is closed | meters |
| depth_mid | mid-depth of tow | meters |
| abundance_total | total number of all taxa counted | no. per cubic meter per net |
| biomass_total | total wet weight of zooplankton in net | milligrams per meter<sup>3</sup> |
| taxon | scientific name or common name of organism or group | |
| abundance | number of the specific taxa counted | no. per meter<sup>3</sup>pernet |
| biomass | wet weight of the specific taxa in the net | milligrams per meter<sup>3</sup> |
| Dataset-specific Instrument Name | MOCNESS1 |
| Generic Instrument Name | MOCNESS1 |
| Dataset-specific Description | The MOCNESS-1 plankton sampler has nine rectangular nets (1m x 1.4 m) with a mesh size of 0.333 mm, which are opened and closed sequentially by commands through conducting cable from the surface (Wiebe et al., 1976). |
| Generic Instrument Description | The Multiple Opening/Closing Net and Environmental Sensing System or MOCNESS is a family of net systems based on the Tucker Trawl principle. The MOCNESS-1 carries nine 1-m2 nets usually of 335 micrometer mesh and is intended for use with the macrozooplankton. All nets are black to reduce contrast with the background. A motor/toggle release assembly is mounted on the top portion of the frame and stainless steel cables with swaged fittings are used to attach the net bar to the toggle release. A stepping motor in a pressure compensated case filled with oil turns the escapement crankshaft of the toggle release which sequentially releases the nets to an open then closed position on command from the surface. -- from the MOCNESS Operations Manual (1999 + 2003). |
NBP0103
| Website | |
| Platform | RVIB Nathaniel B. Palmer |
| Report | |
| Start Date | 2001-04-24 |
| End Date | 2001-06-05 |
NBP0104
| Website | |
| Platform | RVIB Nathaniel B. Palmer |
| Report | |
| Start Date | 2001-07-22 |
| End Date | 2001-08-31 |
U.S. GLOBEC Southern Ocean (SOGLOBEC)
The fundamental objectives of United States Global Ocean Ecosystems Dynamics (U.S. GLOBEC) Program are dependent upon the cooperation of scientists from several disciplines. Physicists, biologists, and chemists must make use of data collected during U.S. GLOBEC field programs to further our understanding of the interplay of physics, biology, and chemistry. Our objectives require quantitative analysis of interdisciplinary data sets and, therefore, data must be exchanged between researchers. To extract the full scientific value, data must be made available to the scientific community on a timely basis.
GLOBEC: Winter Distribution and Success of Southern Ocean Krill (Southern Ocean Krill)
The U.S. Global Ocean Ecosystems Dynamics (U.S. GLOBEC) program has the goal of understanding and ultimately predicting how populations of marine animal species respond to natural and anthropogenic changes in climate. Research in the Southern Ocean (SO) indicates strong coupling between climatic processes and ecosystem dynamics via the annual formation and destruction of sea ice. The Southern Ocean GLOBEC Program (SO GLOBEC) will investigate the dynamic relationship between physical processes and ecosystem responses through identification of critical parameters that affect the distribution, abundance and population dynamics of target species. The overall goals of the SO GLOBEC program are to elucidate shelf circulation processes and their effect on sea ice formation and krill distribution, and to examine the factors which govern krill survivorship and availability to higher trophic levels, including penguins, seals and whales. The focus of the U.S. contribution to the international SO GLOBEC program will be on winter processes. This component will focus on juvenile and adult krill and mesozooplankton prey distribution and abundance using a sophisticated instrument package, BIOMAPPER II, which is equipped with an acoustic backscatter sonar system, a video plankton recorder and an environmental sensor system. The system is used in large-scale studies. Additionally, a remotely-operative vehicle will be used to map the distribution and behavior of krill under ice. The result of the integrated SO GLOBEC program will be to improve the predictability of living marine resources, especially with respect to local and global climatic shifts.
U.S. GLOBal ocean ECosystems dynamics (U.S. GLOBEC)
U.S. GLOBEC (GLOBal ocean ECosystems dynamics) is a research program organized by oceanographers and fisheries scientists to address the question of how global climate change may affect the abundance and production of animals in the sea.
The U.S. GLOBEC Program currently had major research efforts underway in the Georges Bank / Northwest Atlantic Region, and the Northeast Pacific (with components in the California Current and in the Coastal Gulf of Alaska). U.S. GLOBEC was a major contributor to International GLOBEC efforts in the Southern Ocean and Western Antarctic Peninsula (WAP).
| Funding Source | Award |
|---|---|
| NSF Antarctic Sciences (NSF ANT) |
[ table of contents | back to top ]