| Contributors | Affiliation | Role |
|---|---|---|
| Schlitz, Ronald | National Marine Fisheries Service (NMFS) | Principal Investigator |
| Allison, Dicky | Woods Hole Oceanographic Institution (WHOI BCO-DMO) | BCO-DMO Data Manager |
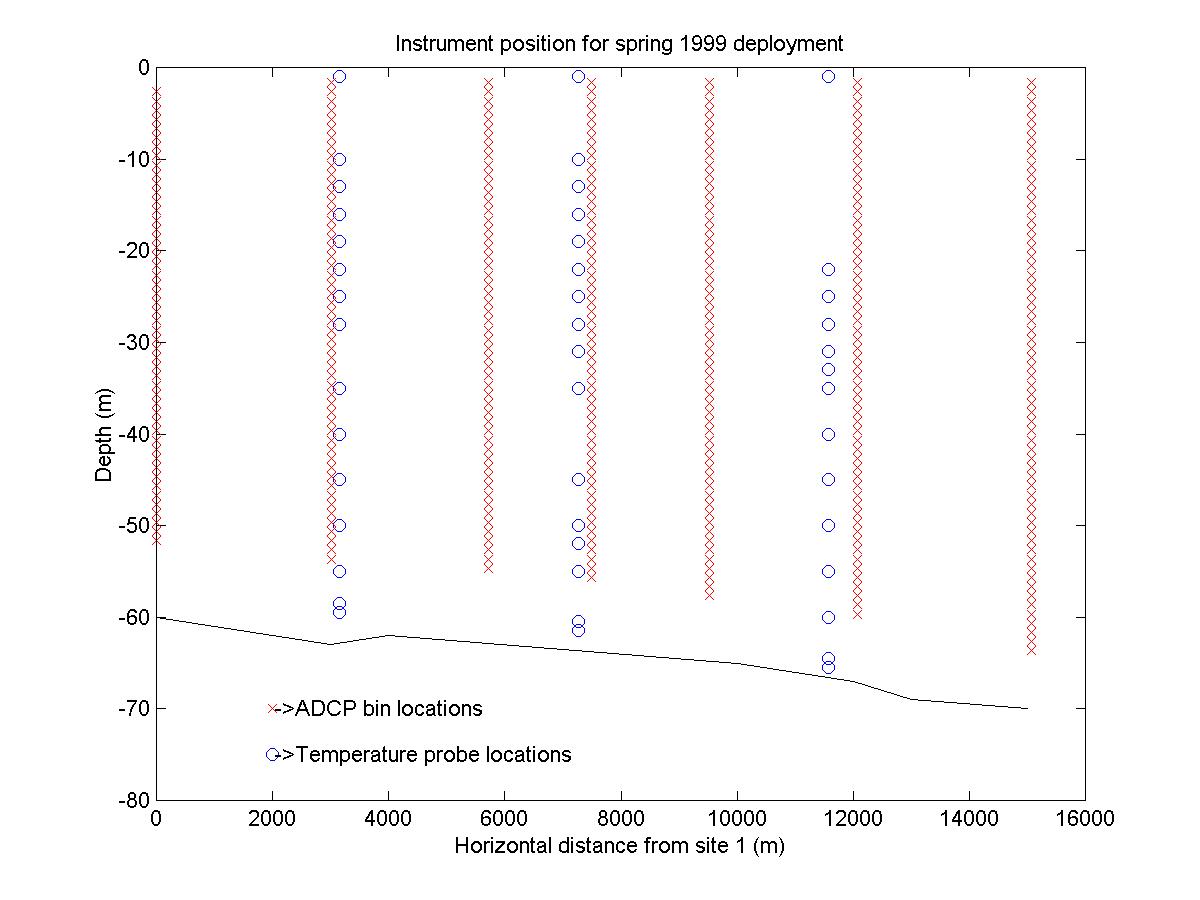
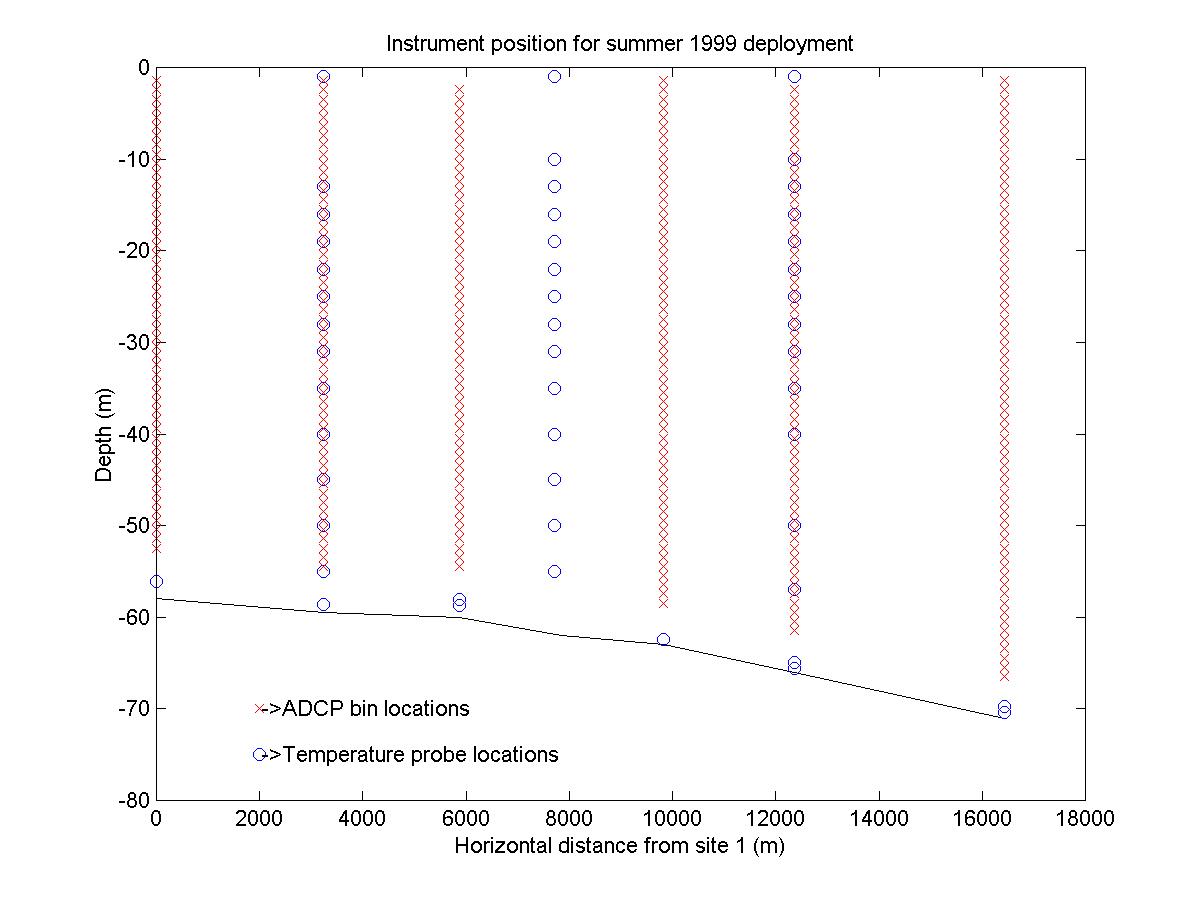
These movies depict low pass filtered velocity and temperature data from the southern flank of Georges Bank in 1999. The movies have been broken up between the spring (3/21/1999-6/10/1999) and summer (6/18/1999-8/30/1999) deployments. The instruments were moved slightly south east for the summer deployment (see Mooring Positions). The instruments were deployed colinearly roughly orthogonal to the isobaths. Velocity was measured with seven broadband (300 KHz) workhorse ADCPs which were mounted on tripods on the ocean bottom. Temperature was measured with strings of vemco temperature probes, brankers, and the internal temperature sensors on the ADCPs. The vertical and horizontal position of the instruments recovered after each deployment are depicted in spring_array.jpg and summer_array.jpg (see spring_array.gif and summer_array.gif for gif versions.) The time between frames in each movie is one hour. All contouring and quiver plots used bilinear interpolation.
spring/summer_velocity.fli: The top of each frame in this movie depicts the low passed three dimensional velocity field. The along bank (75 degrees clockwise from north) velocity is contoured with a contour interval of one cm/sec, a colorbar on the right gives the scale. Positive velocities (red) are up bank, to the east-north east. The cross bank (165 degrees clockwise from north) and vertical velocity are depicted by a two dimensional vector field with a scale given in the lower left hand corner. The topography shown in this frame is a about four meters higher than in reality to cover the edge artifacts in the countouring. At the bottom of the frame is a stick plot of the previous 48 hours of wind. The wind vectors are oriented so that up is north and to the right of the screen is to the east. the vectors move backwards in time from the right of the screen to the left.
spring/summer_velocity_temperature.fli: The top and bottom window of each movie frame are the same as those decribed in spring_1999_SFGB_velocity.fli. The middle window contains a contour of the low passed temperature data. The temperature is contoured with half a degree Celsius contour intervals, the temperature scale is given by the colorbar to the right.
A few artifacts in these films * Because of surface elevation changes the top bin of the ADCP's often give false measurements. Please interperet velocity measurements in the top 5 meters of the water column with a grain of salt.
**The branker temperature probe at one meter depth site 2 failed towards the end of the first deployment causing the odd temperature contour at the end of the movie spring_1999_SFGB_velocity_temperature.fli.
*** All movies are in FLI format which can be viewed with xanim on a unix platform or with PowerFliC on a PC. A zipped copy of PowerFLiC is available in the file pwflc252.zip.
For further information contact: Keston Smith (ksmith@whsun1.wh.whoi.edu) or Ron Schlitz (rschlitz@whsun1.wh.whoi.edu)
| File |
|---|
SF_vel_temp.csv (Comma Separated Values (.csv), 2.59 KB) MD5:67730ed95b02e14fa2e48b72d03bf3d7 Primary file for dataset 2409 |
| Parameter | Description | Units |
| file_link | Model output. Movies of water flow over Georges Bank. | |
| title | ||
| movie | Model output. Movies of water flow over Georges Bank. | text |
| Dataset-specific Instrument Name | Acoustic Doppler Current Profiler |
| Generic Instrument Name | Acoustic Doppler Current Profiler |
| Dataset-specific Description | Acoustic Doppler Current Profiler, encompasses an array of band widths and frequencies.
Velocity was measured with seven broadband (300 KHz) workhorse ADCPs which were mounted on tripods on the ocean bottom. Temperature was measured with strings of vemco temperature probes, brankers, and the internal temperature sensors on the ADCPs |
| Generic Instrument Description | The ADCP measures water currents with sound, using a principle of sound waves called the Doppler effect. A sound wave has a higher frequency, or pitch, when it moves to you than when it moves away. You hear the Doppler effect in action when a car speeds past with a characteristic building of sound that fades when the car passes. The ADCP works by transmitting "pings" of sound at a constant frequency into the water. (The pings are so highly pitched that humans and even dolphins can't hear them.) As the sound waves travel, they ricochet off particles suspended in the moving water, and reflect back to the instrument. Due to the Doppler effect, sound waves bounced back from a particle moving away from the profiler have a slightly lowered frequency when they return. Particles moving toward the instrument send back higher frequency waves. The difference in frequency between the waves the profiler sends out and the waves it receives is called the Doppler shift. The instrument uses this shift to calculate how fast the particle and the water around it are moving. Sound waves that hit particles far from the profiler take longer to come back than waves that strike close by. By measuring the time it takes for the waves to bounce back and the Doppler shift, the profiler can measure current speed at many different depths with each series of pings. (More from WHOI instruments listing). |
The U.S. GLOBEC Georges Bank Program is a large multi- disciplinary multi-year oceanographic effort. The proximate goal is to understand the population dynamics of key species on the Bank - Cod, Haddock, and two species of zooplankton (Calanus finmarchicus and Pseudocalanus) - in terms of their coupling to the physical environment and in terms of their predators and prey. The ultimate goal is to be able to predict changes in the distribution and abundance of these species as a result of changes in their physical and biotic environment as well as to anticipate how their populations might respond to climate change.
The effort is substantial, requiring broad-scale surveys of the entire Bank, and process studies which focus both on the links between the target species and their physical environment, and the determination of fundamental aspects of these species' life history (birth rates, growth rates, death rates, etc).
Equally important are the modelling efforts that are ongoing which seek to provide realistic predictions of the flow field and which utilize the life history information to produce an integrated view of the dynamics of the populations.
The U.S. GLOBEC Georges Bank Executive Committee (EXCO) provides program leadership and effective communication with the funding agencies.
U.S. GLOBEC (GLOBal ocean ECosystems dynamics) is a research program organized by oceanographers and fisheries scientists to address the question of how global climate change may affect the abundance and production of animals in the sea.
The U.S. GLOBEC Program currently had major research efforts underway in the Georges Bank / Northwest Atlantic Region, and the Northeast Pacific (with components in the California Current and in the Coastal Gulf of Alaska). U.S. GLOBEC was a major contributor to International GLOBEC efforts in the Southern Ocean and Western Antarctic Peninsula (WAP).
| Funding Source | Award |
|---|---|
| National Science Foundation (NSF) | |
| National Oceanic and Atmospheric Administration (NOAA) |