| Contributors | Affiliation | Role |
|---|---|---|
| Limeburner, Richard | Woods Hole Oceanographic Institution (WHOI) | Principal Investigator |
| Groman, Robert C. | Woods Hole Oceanographic Institution (WHOI BCO-DMO) | BCO-DMO Data Manager |
Yearly Animations of Northwest Atlantic Surface Temperature Showing the Interactions of Gulf Stream Rings and Meanders with the Shelf Water over Georges Bank and Browns Bank.
Richard Limeburner
WHOI
Woods Hole, MA
rlimeburner@whoi.edu
2/27/2000
Daily 3-day composite SST images of the Northwest Atlantic were obtained from the John Hopkins University Applied Physics Lab AVHRR web site and combined into yearly animations of ocean surface temperature for the period December 1996 to January 2000. The objective of this effort was to document the times when Gulf Stream rings entrained shelf water and/or intruded slope water onto the shelf near Georges Bank and Browns Bank.
The animations are in a flc format and require a player. Sources of free players are available from http://www.gromada.com/index.html (the Moyager PC player) and http://globec.whoi.edu/globec-dir/aaplay.html. In the near future these animations will automatically play over the Internet without installing the players.
The JHUAPL SST data archives begin December 1996 for the Gulf Stream region and the yearly animations are named sst97.flc, sst98.flc, and sst99.flc. The 60-m and 200-m isobaths were laid over the SST imagery and a time stamp was added. The date of each SST image corresponds to the center of a 3-day window of images that were made into a composite image.
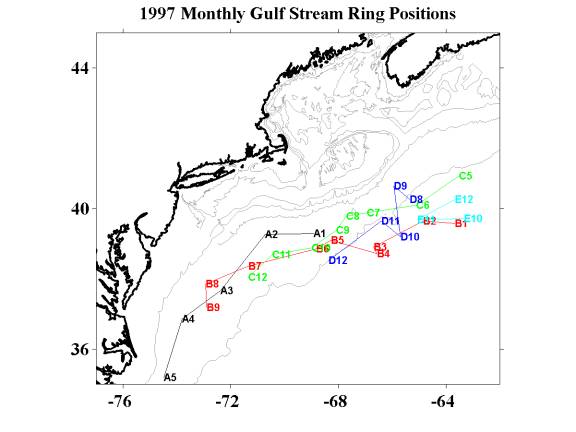
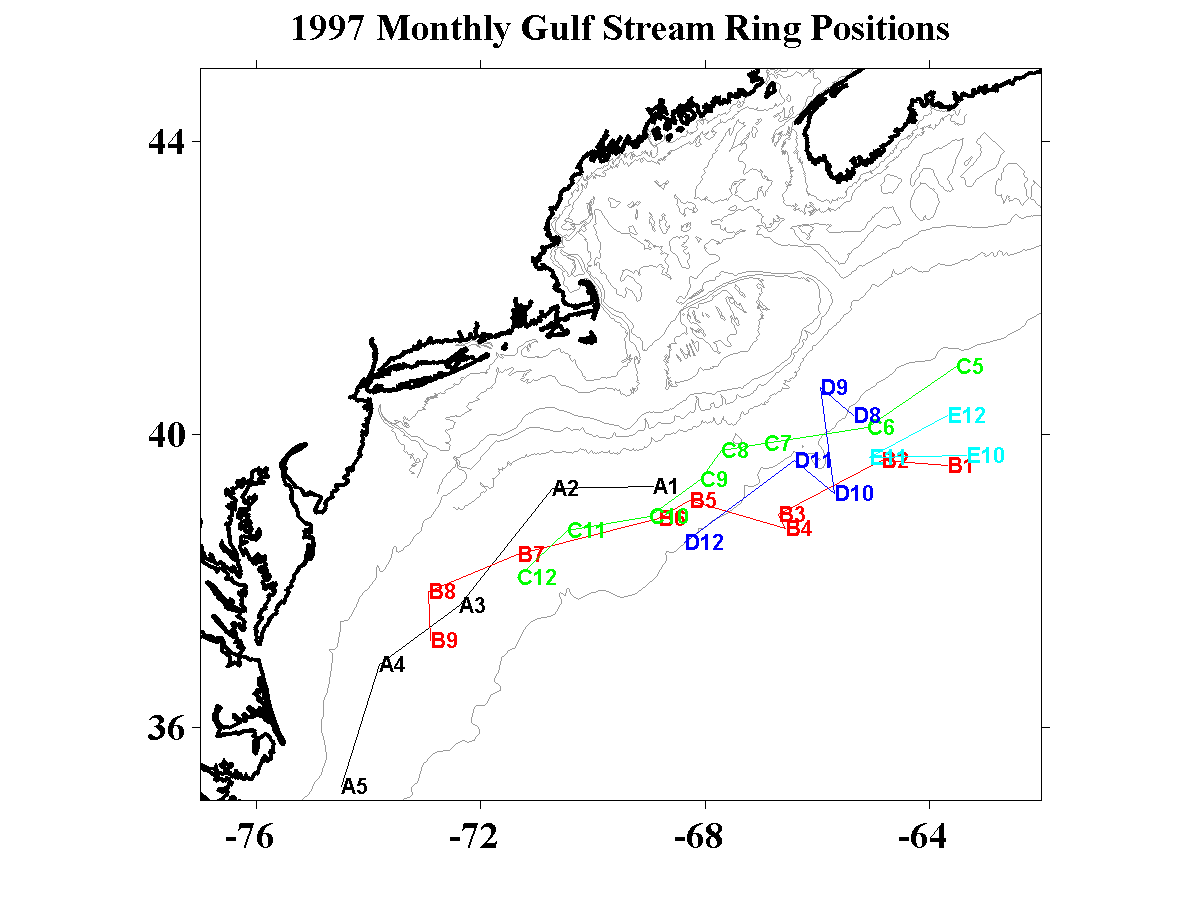
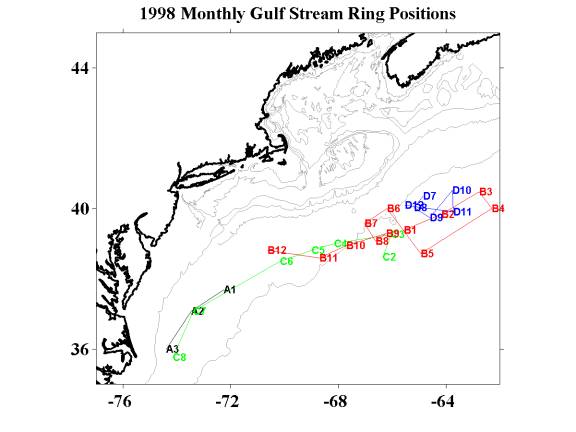
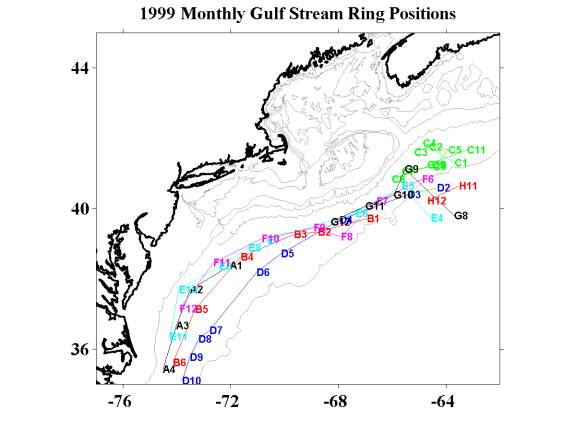
The monthly locations of Gulf Stream rings was located in the animations and plotted below for each year. Note the anomalously high number of rings in 1999.
Figure 1. 1997 monthly ring positions JPEG, PNG.
Figure 2. 1998 monthly ring positions JPEG, PNG.
Figure 3. 1999 monthly ring positions JPEG, PNG.
The presence of GS Ring Water (R) and Warm Slope Water (S) north of the 200-m isobath on the south side of Georges Bank is shown for 1997 (Table 1), 1998 (Table 2, not available), and 1999 (Table 3, not available).
Daily 3-day composite SST images of the Northwest Atlantic were obtained from the John Hopkins University Applied Physics Lab AVHRR web site and combined into yearly animations of ocean surface temperature for the period December 1996 to January 2000.
The JHUAPL SST data archives begin December 1996 for the Gulf Stream region and the yearly animations are named sst97.flc, sst98.flc, and sst99.flc. The 60-m and 200-m isobaths were laid over the SST imagery and a time stamp was added. The date of each SST image corresponds to the center of a 3-day window of images that were made into a composite image.
| File |
|---|
gs_rings.csv (Comma Separated Values (.csv), 340 bytes) MD5:8ab0c3b8d250212986bb5dbc49bfdae4 Primary data file for dataset ID 2444 |
| Parameter | Description | Units |
| year | year | |
| animations | Yearly animations of surface water temperature showing Gulf Stream ring flow over Georges Bank and Browns Bank. |
| Dataset-specific Instrument Name | Advanced Very High Resolution Radiometer |
| Generic Instrument Name | Advanced Very High Resolution Radiometer |
| Dataset-specific Description | Advanced Very High Resolution Radiometer (AVHRR). Carried aboard the National Oceanic and Atmospheric Administration`s (NOAA) Polar Orbiting Environmental Satellite series, the AVHRR sensor is a broad-band, 4- or 5-channel scanning radiometer, sensing in the visible, near-infrared, and thermal infrared portions of the electromagnetic spectrum.
Additional description. |
| Generic Instrument Description | "The AVHRR instrument consists of an array of small sensors that record (as digital numbers) the amount of visible and infrared radiation reflected and (or) emitted from the Earth's surface" (more information). |
| Website | |
| Platform | NOAA-14 |
| Start Date | 1994-12-30 |
| End Date | 2007-05-23 |
| Description | NOAA Satellites Methods & Sampling Daily 3-day composite SST images of the Northwest Atlantic were obtained from the John Hopkins University Applied Physics Lab AVHRR web site and combined into yearly animations of ocean surface temperature for the period December 1996 to January 2000. This image is for the year 1997. Processing Description The JHUAPL SST data archives begin December 1996 for the Gulf Stream region and the yearly animations are named sst97.flc, sst98.flc, and sst99.flc. The 60-m and 200-m isobaths were laid over the SST imagery and a time stamp was added. The date of each SST image corresponds to the center of a 3-day window of images that were made into a composite image. |
| Website | |
| Platform | NOAA-14 |
| Start Date | 1994-12-30 |
| End Date | 2007-05-23 |
| Description | NOAA Satellites Methods & Sampling Daily 3-day composite SST images of the Northwest Atlantic were obtained from the John Hopkins University Applied Physics Lab AVHRR web site and combined into yearly animations of ocean surface temperature for the period December 1996 to January 2000. This is for the year 1998. Processing Description The JHUAPL SST data archives begin December 1996 for the Gulf Stream region and the yearly animations are named sst97.flc, sst98.flc, and sst99.flc. The 60-m and 200-m isobaths were laid over the SST imagery and a time stamp was added. The date of each SST image corresponds to the center of a 3-day window of images that were made into a composite image. |
| Website | |
| Platform | NOAA-14 |
| Start Date | 1994-12-30 |
| End Date | 2007-05-23 |
| Description | NOAA Satellites Methods & Sampling Daily 3-day composite SST images of the Northwest Atlantic were obtained from the John Hopkins University Applied Physics Lab AVHRR web site and combined into yearly animations of ocean surface temperature for the period December 1996 to January 2000. This is for the year 1999. Processing Description The JHUAPL SST data archives begin December 1996 for the Gulf Stream region and the yearly animations are named sst97.flc, sst98.flc, and sst99.flc. The 60-m and 200-m isobaths were laid over the SST imagery and a time stamp was added. The date of each SST image corresponds to the center of a 3-day window of images that were made into a composite image. |
| Website | |
| Platform | NOAA-15 |
| Start Date | 1998-05-13 |
| Description | NOAA Satellites Methods & Sampling Daily 3-day composite SST images of the Northwest Atlantic were obtained from the John Hopkins University Applied Physics Lab AVHRR web site and combined into yearly animations of ocean surface temperature for the period December 1996 to January 2000. This dataset deployment includes images from 1998 and 1999. Processing Description The JHUAPL SST data archives begin December 1996 for the Gulf Stream region and the yearly animations are named sst97.flc, sst98.flc, and sst99.flc. The 60-m and 200-m isobaths were laid over the SST imagery and a time stamp was added. The date of each SST image corresponds to the center of a 3-day window of images that were made into a composite image. |
The U.S. GLOBEC Georges Bank Program is a large multi- disciplinary multi-year oceanographic effort. The proximate goal is to understand the population dynamics of key species on the Bank - Cod, Haddock, and two species of zooplankton (Calanus finmarchicus and Pseudocalanus) - in terms of their coupling to the physical environment and in terms of their predators and prey. The ultimate goal is to be able to predict changes in the distribution and abundance of these species as a result of changes in their physical and biotic environment as well as to anticipate how their populations might respond to climate change.
The effort is substantial, requiring broad-scale surveys of the entire Bank, and process studies which focus both on the links between the target species and their physical environment, and the determination of fundamental aspects of these species' life history (birth rates, growth rates, death rates, etc).
Equally important are the modelling efforts that are ongoing which seek to provide realistic predictions of the flow field and which utilize the life history information to produce an integrated view of the dynamics of the populations.
The U.S. GLOBEC Georges Bank Executive Committee (EXCO) provides program leadership and effective communication with the funding agencies.
U.S. GLOBEC (GLOBal ocean ECosystems dynamics) is a research program organized by oceanographers and fisheries scientists to address the question of how global climate change may affect the abundance and production of animals in the sea.
The U.S. GLOBEC Program currently had major research efforts underway in the Georges Bank / Northwest Atlantic Region, and the Northeast Pacific (with components in the California Current and in the Coastal Gulf of Alaska). U.S. GLOBEC was a major contributor to International GLOBEC efforts in the Southern Ocean and Western Antarctic Peninsula (WAP).
| Funding Source | Award |
|---|---|
| National Science Foundation (NSF) | |
| National Oceanic and Atmospheric Administration (NOAA) |