CTD Profile Data from R/V Roger Revelle KNOX22RR in the Patagonian Shelf (SW South Atlantic) from December 2008 (COPAS08 project)
Project
Program
| Contributors | Affiliation | Role |
|---|---|---|
| Painter, Stuart | National Oceanography Centre (NOC) | Principal Investigator, Contact |
| Allen, John T | National Oceanography Centre (NOC) | Co-Principal Investigator |
| Gegg, Stephen R. | Woods Hole Oceanographic Institution (WHOI BCO-DMO) | BCO-DMO Data Manager |
Final calibrated data (salinity and oxygen) for the downcast part of each profile of the CTD dataset collected during KNOX22RR (COPAS'08) cruise to the Patagonian Shelf
The calibration procedure for both conductivity and for oxygen is explained in the processing description.
Station Notes
- Station ctd22RRb2401: Odd name due to unusual sampling positions (between stations)
- Station ctd22RRb2501: Odd name due to unusual sampling positions (between stations)
- Station ctd22RRb2601: Odd name due to unusual sampling positions (between stations)
- Station ctd22RRb4701: Odd name due to unusual sampling positions (between stations)
- Station ctd22RRb6001: Odd name due to unusual sampling positions (between stations)
- Station ctd22RR08901: During the upcast communications with the CTD package failed
and the data files were considered corrupt and subsequently not processed. There is no data for this station
- Station ctd22RR14601: This station was scheduled but in the end not sampled due to time constraints. There is no data for this station
- Station ctd22RR14701: This station was scheduled but in the end not sampled due to time constraints. There is no data for this station
The station plan generally had CTD stations at 30km resolution over the entire cruise, except for the first line from Montevideo (in which stations were further apart as the science party became more adept at running casts and processing water. After the first line was complete, a long diagonal line was run in a SW direction, with water sampling every station. For all subsequent stations, every other station was processed for a full water cast and CTD profile. The station design always placed the full stations at corners of the transit patterns. This station plan translated to a total of 152 stations, with 76 full-cast water stations. The CTD was equipped with an oxygen sensor and beam transmissometer (at 660nm). Stand-alone pumps (SAPS) were deployed at varying parts of the cruise, with two water depths sampled. A hand-deployed light meter was deployed daily at local apparent noon, weather conditions permitting. This provided spectral estimates of the diffuse attenuation. Experiments on ocean acidification were performed in deck incubators in ambient seawater tanks.
In total 168 CTD profiles were completed on cruise KNOX22RR. The maximum depth of the profiles varied from less than 10 m for the collection of water for separate carboy experiments performed by other cruise participants to a maximum of 5204 m. Most casts, however, extended to ~1000 m offshore and were limited by topography along the shelf break and inshore.
Profile casts down to 1000 m were interspersed with water collection casts to increase the along-track resolution of the hydrographic data and to resolve the deeper structure beyond the euphotic zone.
SeaBird CTD Processing
Data was acquired using SeaBird SeaSave for SBE 911 software (v7). Following each cast, data acquisition was stopped and saved to the deck unit PC. The logging software output four files per cast with the following forms: nnnnn.hex (raw data file), nnnnn.con (data configuration file), nnnnn.bl (contained record of bottle firing locations and nnnnn.hdr (header file), where 'nnnnn' was the 3-digit station number followed by the 2-digit cast number. Raw data files were processed using SeaBird SBE Data Processing software version 7.18b according to Scripps Oceanographic Institute protocols. Output files from the SeaBird processing were of the form nnnnn.cnv (binary up and down casts), nnnnn.btl and nnnnn.ros (bottle firing information). Instrument manufacturer calibrations are used in these processing stages.
Additional data processing was continued within Mstar, a Matlab based data processing system developed at the National Oceanography Centre, Southampton. A brief summary of the processing steps and relevant scripts is provided below. Intermediate processing files have not been submitted to the BCO-DMO database. Only the final calibrated downcast data has been submitted (so called 2db files)
Basic CTD data processing
ctd0: This converts the SBE processed 24Hz SeaBird .cnv file into netCDF format, setting the required header information.
Output: ctd22RRnnnnn_24Hz
ctd1: This carries out a de-spike on the .24Hz data and averages it into a 1Hz file, (ctd22RRnnnnn_1Hz).
Salinity, potential temperature and density are derived from the primary and secondary temperature and conductivity sensors using the international equation of state. Finally a 10 second averaged file is created, (ctd22RRnnnnn_10s).
ctd2: Requires the user to find the first in-water, deepest and last in-water data-cycle from the .1Hz file. This script then extracts data to correspond to the full up and down casts (ctd22RRnnnnn.ctu file) and purely the downcast (ctd22RRnnnnn.2db), averaged into 2db bins.
Advanced data processing for calibration purposes See dataset SAM Data Files
fir0: This converts the SBE processed .ros file into netCDF format. It then takes relevant data-cycles from the .10s averaged file and pastes them into a new file fir22RRnnnnn containing the mean values of all the variables at the bottle firing locations.
samfir: This creates a master file (samnnnnn) for the cast from a blank template file and pastes in selected variables from the fir22RRnnnnn file. Variable selection depends upon the variables listed in the template file.
sal0: Converts and reformats the salinity bottle data from salinometry measurements from Excel text files into NetCDF format. Output file: salnnnnn.bot
passal: Pastes salinity bottle file values from salnnnnn.bot into sam22RRnnnnn file.
Output file: sam22RRnnnnn.
botcond: Bottle salinities are twice converted to conductivity values using temperature from the primary and then secondary CTD sensors. This allows independent calibration of the two sensors.
Result added to sam22RRnnnnn files.
CTD calibration
Conductivity calibration
Calibration of the CTD conductivity (salinity) and oxygen sensors was performed on the data. The calibration of the two Seabird conductivity channels to the salinometry results revealed a generally good agreement in both cases but also highlighted the presence of a drift on the
primary conductivity channel, as shown by plots of conductivity difference against station number (i.e. time). This suggests that conductivity 2 and temperature 2 (from the secondary CTD sensor) provide more reliable estimates of salinity although the overall impact of the drift on the primary channel remained small.
SeaBird claims that the correct in-situ calibration for their conductivity sensors is a linear function of conductivity with no offset. Plots of conductivity difference against conductivity added support to this and therefore the calibration coefficients A and B were calculated as
conductivity = A* ( primary conductivity)
conductivity = B* (secondary conductivity)
where
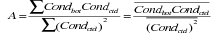
and
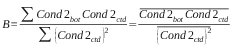
and cond2bot is the sample bottle conductivity determined with the secondary temperature variable.
Coefficient A was determined to be 1.000186 and coefficient B was determined to be 1.000098.
Corrected Seabird conductivities were calculated through the application of coefficient A to primary conductivity and coefficient B to the secondary conductivity channel.
Residual conductivity differences calculated as bottle conductivity minus corrected Seabird conductivity (btc-uc) were typically ±0.003 mS/cm for both channels but considerable scatter was present within the data.
The mean (±stdev) conductivity residuals were -0.000051±0.0027 mS/cm and 0.00000051±0.0019 mS/cm for conductivity channels 1 and 2 respectively.
Oxygen calibration
The linear regression between Seabird 43 oxygen concentrations (in ml/l) and manual Winkler titrations produced a regression equation of
y = 1.048204 * SBEoxy + 0.058575
where y = corrected oxygen concentration.
The typical range of residual values (i.e. corrected Seabird oxygen concentration - bottle titration estimate) was ±0.06 ml/l.
The mean (±stdev) residual estimate however was 0.0036±0.0395 ml/l.
BCO-DMO Edits
- Original data contributed as NetCDF files
- ARM Tools NetCDF Windows routine cdf2ascii.exe used to convert the data to ASCII format
- ARM Tools NetCDF Windows routine ncdump.exe used to extract header information (parameters and sensors)
- CTD Station id, date, time, lat, lon imported from file: COPAS08_ctd_positions_updated.xls
Station Notes
- Station ctd22RRb2401: Odd name due to unusual sampling positions (between stations)
- Station ctd22RRb2501: Odd name due to unusual sampling positions (between stations)
- Station ctd22RRb2601: Odd name due to unusual sampling positions (between stations)
- Station ctd22RRb4701: Odd name due to unusual sampling positions (between stations)
- Station ctd22RRb6001: Odd name due to unusual sampling positions (between stations)
- Station ctd22RR08901: During the upcast communications with the CTD package failed and the data files were considered corrupt and subsequently not processed. There is no data for this station
- Station ctd22RR14601: This station was scheduled but in the end not sampled due to time constraints. There is no data for this station
- Station ctd22RR14701: This station was scheduled but in the end not sampled due to time constraints. There is no data for this station
| File |
|---|
CTD_Profiles.csv (Comma Separated Values (.csv), 18.56 MB) MD5:cda4841b3221369c184f321d46aac05e Primary data file for dataset ID 3348 |
| Parameter | Description | Units |
| station | COPAS'08 station Id | text |
| date | date (GMT) at bottom of cast | YYYYMMDD |
| time_at_bottom | time (GMT) at bottom of cast | HHMMSS |
| lon | Station longitude at bottom of cast (West is negative) | decimal degrees |
| lat | Station latitude at bottom of cast (South is negative) | decimal degrees |
| depth | Sample depth at bottom of cast | meters |
| filename | dataset filename | text |
| time | time | seconds |
| press | press | db |
| temp | temp | degC |
| cond | cond | mS/cm |
| temp2 | temp2 | degC |
| cond2 | cond2 | mS/cm |
| fluor | fluor | ug/l |
| trans | trans | percentage |
| beam_atten | beam_atten | 1/m |
| par | par | W/m2 |
| spar | spar | W/m2 |
| cpar | cpar | percentage |
| soundVel | soundVel | m/s |
| c2_minus_c1 | c2_minus_c1 | mS/cm |
| t2_minus_t1 | t2_minus_t1 | degC |
| condcal | condcal | mS/cm |
| cond2cal | cond2cal | mS/cm |
| condr | condr | number |
| cond2r | cond2r | number |
| salin | salin | PSU |
| salin2 | salin2 | PSU |
| ptemp | ptemp | degC |
| ptemp2 | ptemp2 | degC |
| sigma0 | sigma0 | kg/m3 |
| sigma0_2 | sigma0_2 | kg/m3 |
| sbeoxy | sbeoxy | ml/l |
| sbe_oxy | sbe_oxy | umol/kg |
| oxysat | oxysat | ml/l |
| sbeoxysat | sbeoxysat | percentage |
| Dataset-specific Instrument Name | CTD Sea-Bird 911 |
| Generic Instrument Name | CTD Sea-Bird 911 |
| Dataset-specific Description | Data was acquired using SeaBird SeaSave for SBE 911 software (v7)
Sample Header File
* Sea-Bird SBE 9 Data File:
* FileName = C:/CTD/balch-12-2008/06101.hex
* Software Version Seasave V 7.18b
* Temperature SN = 4307
* Conductivity SN = 2593
* Number of Bytes Per Scan = 44
* Number of Voltage Words = 5
* Number of Scans Averaged by the Deck Unit = 1
* Append System Time to Every Scan
* System UpLoad Time = Dec 17 2008 12:46:09
* NMEA Latitude = 48 45.00 S
* NMEA Longitude = 059 47.47 W
* NMEA UTC (Time) = Dec 17 2008 12:46:10
* Store Lat/Lon Data = Append to Every Scan
** Station/Cast: 06101
** LAT: 48 45.000S
** LON: 59 47.475W
** Bottom Depth: 466
** Cast Type: DN
** Event No: 200812171246
# units = specified
# bad_flag = -9.990e-29
# sensor 0 = Frequency 0 temperature, primary, 4307, 11-Sep-08
# sensor 1 = Frequency 1 conductivity, primary, 2593, 03-Sep-08 , cpcor = -9.5700e-08
# sensor 2 = Frequency 2 pressure, 0831, 17-Sep-08
# sensor 3 = Frequency 3 temperature, secondary, 2495, 11-Sep-08
# sensor 4 = Frequency 4 conductivity, secondary, 2766, 09-Sep-08 , cpcor = -9.5700e-08
# sensor 5 = Extrnl Volt 0 Fluorometer, Seapoint, primary
# sensor 6 = Extrnl Volt 1 irradiance (PAR), primary, 4644, 11 Feb. 2004
# sensor 7 = Extrnl Volt 2 transmissometer, primary, CST-1115-DR, 01 May 2008
# sensor 8 = Extrnl Volt 4 altimeter
# sensor 9 = Extrnl Volt 6 Oxygen, SBE, primary, 1129, 30-May-08p
# sensor 10 = Extrnl Volt 9 surface irradiance (SPAR), degrees = 0.0
# datcnv_date = Dec 17 2008 23:17:36, 7.18b
# datcnv_in = w:/06101.hex w:/06101.CON
# datcnv_skipover = 4800
# datcnv_ox_hysteresis_correction = yes
# datcnv_ox_tau_correction = yes
# wildedit_date = Dec 17 2008 23:17:41, 7.18b
# wildedit_in = w:/06101.cnv
# wildedit_pass1_nstd = 2.0
# wildedit_pass2_nstd = 10.0
# wildedit_pass2_mindelta = 0.000e+000
# wildedit_npoint = 500
# wildedit_vars = prDM t090C c0mS/cm t190C c1mS/cm sbeox0ML/L sbeox0Mm/Kg sbeox0PS flSP xmiss bat par spar cpar altM
# wildedit_excl_bad_scans = yes
# filter_date = Dec 17 2008 23:17:46, 7.18b
# filter_in = w:/06101.cnv
# filter_low_pass_tc_A = 0.030
# filter_low_pass_tc_B = 0.150
# filter_low_pass_A_vars =
# filter_low_pass_B_vars = prDM
# alignctd_date = Dec 17 2008 23:17:54, 7.18b
# alignctd_in = w:/06101.cnv
# alignctd_adv = sbeox0ML/L 7.000, sbeox0Mm/Kg 7.000, sbeox0PS 7.000
# celltm_date = Dec 17 2008 23:17:59, 7.18b
# celltm_in = w:/06101.cnv
# celltm_alpha = 0.0300, 0.0300
# celltm_tau = 7.0000, 7.0000
# celltm_temp_sensor_use_for_cond = primary, secondary
# loopedit_date = Dec 17 2008 23:18:03, 7.18b
# loopedit_in = w:/06101.cnv
# loopedit_minVelocity = 0.050
# loopedit_surfaceSoak: do not remove
# loopedit_excl_bad_scans = yes
# Derive_date = Dec 17 2008 23:18:10, 7.18b
# Derive_in = w:/06101.cnv w:/06101.CON# file_type = ascii
*END*
This mstar file created from sbe file 06101.cnv at 2008-12-18 11:22:36
condcal = 1.000186 * cond
cond2cal = 1.000098 * cond2
oxygen calibration = 0.058575 + 1.048204 * sbeoxy |
| Generic Instrument Description | The Sea-Bird SBE 911 is a type of CTD instrument package. The SBE 911 includes the SBE 9 Underwater Unit and the SBE 11 Deck Unit (for real-time readout using conductive wire) for deployment from a vessel. The combination of the SBE 9 and SBE 11 is called a SBE 911. The SBE 9 uses Sea-Bird's standard modular temperature and conductivity sensors (SBE 3 and SBE 4). The SBE 9 CTD can be configured with auxiliary sensors to measure other parameters including dissolved oxygen, pH, turbidity, fluorescence, light (PAR), light transmission, etc.). More information from Sea-Bird Electronics. |
KNOX22RR
| Website | |
| Platform | R/V Roger Revelle |
| Report | |
| Start Date | 2008-12-04 |
| End Date | 2009-01-02 |
| Description | Cruise KNOX22RR was an expedition to study the Patagonian Shelf coccolithophorid bloom. A total of 168 CTD profiles at 152 stations were completed during the cruise, including 25 dawn primary productivity casts. Depths of the profiles varied from less than 10 m for carboy experiments to a maximum of 5204 m. Most casts, however, extended to 1000 m offshore and were limited by topography along the shelf break and inshore. Profile casts down to 1000 m were interspersed with water casts to increase the along-track resolution of the hydrographic data and to resolve the deeper structure beyond the euphotic zone. On such casts, water was not sampled.
On casts where water was taken, sampling from Niskin bottles took place in the following order: oxygen, DIC/Alk, DMS, DOC, nutrients, primary productivity, PIC/POC/Chl, cyanobacteria distribution, HPLC, virus abundance, salts.
Sampling was carried out at the following fixed light depths: 50%, 30%, 20%, 10%, 5%, 3%, 1%, 0.1%. The depths were calculated based on one of two methods: (a) during the day, percentages of surface irradiance taken from the downcast profile immediately preceding bottle firing or, (b) at night, based on the measured beam transmittance and previously determined relationships between beam transmittance and diffuse attenuation of photosynthetically available radiation (PAR).
Cruise information and original data are available from the NSF R2R data catalog. |
Coccolithophores of the Patagonian Shelf 2008 (COPAS08)
A main focus of the COPAS project is to study coccolithophores at the fringes of the Southern Ocean on the Patagonian Shelf (PS) east of Argentina. Some of the most extensive coccolithophore blooms in the world occur on the PS but the remoteness of the region has impeded their study. In this part of the southern ocean, the most basic knowledge is lacking about a) the relationships between coccolithophores and other species of phytoplankton, b) the impact of coccolithophores on the carbon cycle and c) how environmental changes affect bloom taxonomy and function.
This will be the first multi-disciplinary ship-based investigation of these mesoscale blooms, building on an understanding of coccolithophore ecology derived almost exclusively from northern hemisphere bloom studies. This study will document the ecological factors regulating the spatial-temporal distribution of the coccolithophore blooms (the largest recurring coccolithophorid bloom in the sounthern hemisphere) using a combination of underway, satellite and discrete sampling. Satellite measurements will provide quantitative estimates of particulate inorganic carbon (PIC) and particulate organic carbon (POC) in coccolithophore blooms while underway hydrographic and optical sampling will allow real-time evaluation of coccolithophores in both bloom and surrounding non-bloom waters. Vertical casts across the shelf front will provide depth resolved coccolithophore abundance as well as estimates of phytoplankton species richness.
Another goal is to examine the effects of ocean acidification on algal optical properties, coccolithophore concentrations and PIC concentrations (to be determined from deck experiments). Dilution experiments will provide key estimates on phytoplankton growth rates, coccolithophore growth rates and calcification rates, plus the intrinsic loss rates (i.e. phytoplankton grazing, coccolithophore grazing and dissolution associated with zooplankton grazing). PIC has not been examined in dilution experiments heretofore. The project will yield fundamental insights into a) our understanding of coccolithophore ecology (not just Emiliania huxleyi) and b) the utility of the "functional group" concept to describe coccolithophore variability over the PS. Such knowledge is critical to model complex biogeochemical processes that regulate phytoplankton production and the biological pump. It is also worthy of note that the PS coccolithophore populations are at the western edge of a southern hemisphere belt of enhanced coccolithophores thought to extend from the southern tip of South America to waters south of Australia, (~180 degrees of longitude).
The burning of fossil fuels is predicted to increase atmospheric CO2 to 750 p.p.m.v. or more under various future scenarios. As a large fraction of the anthropogenic CO2 diffuses into seawater, the ocean is becoming more acidic; it is predicted that the pH of the surface ocean will drop by up to 0.7 units by year 2300, a 5-fold increase in the proton concentration. A major goal is to examine the effects of ocean acidification on coccolithophores, in a region of low calcite saturation. This study will provide the first detailed analysis of the coccolithophores in this enormous area of high suspended calcite water. The results will be highly relevant to our basic understanding of the marine carbon cycle.
Financial support for the participating UK scientists was also provided by the Luminescence and Marine Plankton project funded by the Defence Science and Technology Laboratory under the Joint Grant Scheme programme via Proposal Ref. 1166 to Dr. John Allen.
Ocean Carbon and Biogeochemistry (OCB)
The Ocean Carbon and Biogeochemistry (OCB) program focuses on the ocean's role as a component of the global Earth system, bringing together research in geochemistry, ocean physics, and ecology that inform on and advance our understanding of ocean biogeochemistry. The overall program goals are to promote, plan, and coordinate collaborative, multidisciplinary research opportunities within the U.S. research community and with international partners. Important OCB-related activities currently include: the Ocean Carbon and Climate Change (OCCC) and the North American Carbon Program (NACP); U.S. contributions to IMBER, SOLAS, CARBOOCEAN; and numerous U.S. single-investigator and medium-size research projects funded by U.S. federal agencies including NASA, NOAA, and NSF.
The scientific mission of OCB is to study the evolving role of the ocean in the global carbon cycle, in the face of environmental variability and change through studies of marine biogeochemical cycles and associated ecosystems.
The overarching OCB science themes include improved understanding and prediction of: 1) oceanic uptake and release of atmospheric CO2 and other greenhouse gases and 2) environmental sensitivities of biogeochemical cycles, marine ecosystems, and interactions between the two.
The OCB Research Priorities (updated January 2012) include: ocean acidification; terrestrial/coastal carbon fluxes and exchanges; climate sensitivities of and change in ecosystem structure and associated impacts on biogeochemical cycles; mesopelagic ecological and biogeochemical interactions; benthic-pelagic feedbacks on biogeochemical cycles; ocean carbon uptake and storage; and expanding low-oxygen conditions in the coastal and open oceans.
| Funding Source | Award |
|---|---|
| NSF Division of Ocean Sciences (NSF OCE) | |
| Defence Science and Technology Laboratory (DSTL) | |
| National Aeronautics & Space Administration (NASA) |
[ table of contents | back to top ]