CTD full resolution profiles from cruises KN193-03, B4-2008, B9-2008, and B10-2008 in the subpolar North Atlantic and Iceland Basin in 2008 (NAB 2008 project)
Project
Program
| Contributors | Affiliation | Role |
|---|---|---|
| Perry, Mary Jane | University of Maine (U Maine DMC) | Principal Investigator |
| Cetinic, Ivona | University of Maine (U Maine DMC) | Contact |
| McKee, Theresa | Woods Hole Oceanographic Institution (WHOI BCO-DMO) | BCO-DMO Data Manager |
CTD profile data represented an important part of the core measurements and were done on all the cruises. This dataset consists of full-resolution profiles (casts were also processed to one meter-averaged profiles.) Parameters include temperature, conductivity, SBE dissolved oxygen oxygen, chlorophyll fluorescence, optical backscatter, and beam transmission.
| File |
|---|
CTD_full.csv (Comma Separated Values (.csv), 405.01 MB) MD5:15066f25dd0915f7bc1e099fcb36f9ea Primary data file for dataset ID 3409 |
| Parameter | Description | Units |
| Cruise_ID | Cruise identifier | dimensionless |
| date | Date of sample | YYYYMMDD |
| lon | longitude | decimal degrees |
| lat | latitude | decimal degrees |
| beamc_id | Transmissometer Serial number | dimensionless |
| Zmax | Maximum depth reported for the CTD cast | dimensionless |
| cast | station identifier | dimensionless |
| depth | sampling | meter |
| temp | Temperature | degrees Celsius |
| sal | Salinity | dimensionless |
| sigma_0 | water potential density - 1000 | kilograms / meter^3 |
| O2_cal | dissolved oxygen concentration calibrated with Winkler oxygen | micromol / kilogram |
| chl_raw | chlorophyll fluorescence (raw output - dark counts) | volts |
| chl_a_derived | chlorophyll concentration from fluorescence using empirical, cruise-specific algorithm | milligrams / meter^3 |
| ss880_raw | sidescatter (raw output with no dark correction) | volts |
| bbp700 | particulate backscattering coefficient (b sub bp) with excitation at 470 nanometers and emission at 695 nanometers and volume scattering function at 140 degrees and 700 nanometers | meter^-1 |
| beam_cp | particulate attenuation coefficient | meter^-1 |
| CDOM | colored dissolved material fluorescence (raw output with no dark correction) | volts |
| SPAR | surface photosynthetically active radiation (sPAR) | micromol photon / meter^2 / sec |
| PAR | water column photosynthetically active radiation (PAR) | micromol photon / meter^2 / sec |
| POC_cp | particulate organic carbon from particulate attenuation coefficient (cp; see beamc) | milligrams / meter^3 |
| POC_bbp | particulate organic carbon from particulate backscattering coefficient (bbp; see bbp700) | milligrams / meter^3 |
| julian_day_yr0 | day of year; days since January 1, year 0. | dimensionless |
| depth_bottom | bottom depth | meters |
| O2_uncal | dissolved oxygen (uncalibrated) | micromol/kilogram |
| Dataset-specific Instrument Name | QSR-240 |
| Generic Instrument Name | Biospherical QSR-240 surface PAR |
| Generic Instrument Description | Shipboard radiometer with a PAR spectral response (400-700nm) designed to monitor surface irradiance during underwater light profile measurement. Hemispherical collector measuring 2-pi scalar irradiance. |
| Dataset-specific Instrument Name | CTD Sea-Bird SBE 911plus |
| Generic Instrument Name | CTD Sea-Bird SBE 911plus |
| Generic Instrument Description | The Sea-Bird SBE 911 plus is a type of CTD instrument package for continuous measurement of conductivity, temperature and pressure. The SBE 911 plus includes the SBE 9plus Underwater Unit and the SBE 11plus Deck Unit (for real-time readout using conductive wire) for deployment from a vessel. The combination of the SBE 9 plus and SBE 11 plus is called a SBE 911 plus. The SBE 9 plus uses Sea-Bird's standard modular temperature and conductivity sensors (SBE 3 plus and SBE 4). The SBE 9 plus CTD can be configured with up to eight auxiliary sensors to measure other parameters including dissolved oxygen, pH, turbidity, fluorescence, light (PAR), light transmission, etc.). more information from Sea-Bird Electronics |
| Dataset-specific Instrument Name | LI-COR Biospherical PAR Sensor |
| Generic Instrument Name | LI-COR Biospherical PAR Sensor |
| Generic Instrument Description | The LI-COR Biospherical PAR Sensor is used to measure Photosynthetically Available Radiation (PAR) in the water column. This instrument designation is used when specific make and model are not known. |
| Dataset-specific Instrument Name | SBE 43 Dissolved Oxygen Sensor |
| Generic Instrument Name | Sea-Bird SBE 43 Dissolved Oxygen Sensor |
| Generic Instrument Description | The Sea-Bird SBE 43 dissolved oxygen sensor is a redesign of the Clark polarographic membrane type of dissolved oxygen sensors. more information from Sea-Bird Electronics |
| Dataset-specific Instrument Name | Seapoint Turbidity Meter |
| Generic Instrument Name | Seapoint Turbidity Meter |
| Generic Instrument Description | The Seapoint Turbidity Meter detects light scattered by particles suspended in water, generating an output voltage proportional to turbidity or suspended solids. |
| Dataset-specific Instrument Name | Wet Labs CSTAR Transmissometer |
| Generic Instrument Name | WET Labs {Sea-Bird WETLabs} C-Star transmissometer |
| Generic Instrument Description | The C-Star transmissometer has a novel monolithic housing with a highly integrated opto-electronic design to provide a low cost, compact solution for underwater measurements of beam transmittance. The C-Star is capable of free space measurements or flow-through sampling when used with a pump and optical flow tubes. The sensor can be used in profiling, moored, or underway applications. Available with a 6000 m depth rating.
More information on Sea-Bird website: https://www.seabird.com/c-star-transmissometer/product?id=60762467717 |
| Dataset-specific Instrument Name | WETStar ECO FLNTU |
| Generic Instrument Name | WETLabs ECO-FLNTU |
| Generic Instrument Description | The ECO FLNTU is a dual-wavelength, single-angle sensor for simultaneously determining both chlorophyll fluorescence and turbidity. |
| Dataset-specific Instrument Name | WETStar CDOM Fluorometer |
| Generic Instrument Name | WETStar CDOM Fluorometer |
| Generic Instrument Description | The WETStar CDOM fluorometer measuring fluorescence as a proxy for dissolved matter absorption. |
KN193-03
| Website | |
| Platform | R/V Knorr |
| Start Date | 2008-05-01 |
| End Date | 2008-05-22 |
| Description | A three-week process cruise on the R/V Knorr operated in the vicinity of five autonomous platforms that had been deployed in early April by another vessel. A total of 10 simultaneous float and CTD calibration profiles were taken to calibrate sensors on the Lagrangian mixed layer float (Biofloat 48) and to validate proxy measurements (i.e., optical attenuation to particulate organic carbon, etc.). One simultaneous Seaglider and CTD calibration profile was collected for each of the four Seagliders. Knorr also carried out a number of bow-tie surveys around the Lagrangian mixed layer float. A second float, Biofloat 47, had ceased functioning shortly after deployment was rescued at the beginning of the cruise. Two SOLOPC floats were deployed but were damaged on deployment and sank. A number of successful short deployments of PELAGRA floating were made during the cruise.
Core ship-board measurements supported by project funding were: 1) CTD profiles (temperature, conductivity, oxygen, chlorophyll fluorescence, optical backscatter, and beam transmission) on all four cruises; 133 CTD profiles were obtained on this cruise. 2) analysis of water samples collected with the CTD Rosette (chlorophyll, HPLC pigments, nutrients, particulate organic carbon, particulate absorption spectrum, phytoplankton, oxygen and other guest investigator measurements).
Original cruise data are available from the NSF R2R data catalog
Science personnel:
Mary Jane Perry, University of Maine, Chief Scientist
Witold Bagniewsk, University of Maine
Nicole Bale, Plymouth Laboratory, UK
Nathan Briggs, University of Maine
David Checkley, Scripps Institution of Oceanography
Giorgio Dall'Olmo, Oregon State University
Andrea Drzewianowski, University of Maine
Amanda Gray, University of Washington
Jennifer Fortier, University of Maine
Alba Gonzalez-Posada, University of East Anglia, UK
Emily Kallin, University of Maine
Kristinn Gudmundsson, Marine Research Institute, Reykjavik, Iceland
Richard Lampitt, National Oceanography Centre, South Hampton, UK
Patrick Martin, National Oceanography Centre, South Hampton, UK
Maren Moltke Lyngsgaard, University of Copenhagen, Denmark
Nicole Poulton, Bigelow Laboratory
Eric Rehm, University of Washington
Katherine Richardson, University of Copenhagen, Denmark
Ryan Rykaczewski, Scripps Institution of Oceanography
Michael Sauer, University of Maine
Richard Sawyer, National Oceanography Centre, South Hampton, UK
Michael Sieracki, Bigelow Laboratory
Tatiana Rynearson, University of Rhode Island
Toby Westberry, Oregon State University
Dane Wojcicki, University of Maine
Lin Zhang, University of Rhode Island Methods & Sampling The WHOI CTD Rosette on the R/V Knorr was equipped with the following sensors: [NOTE: Sensor owner is identified in parenthesis (WHOI or Perry)] Sea-Bird Electronics 11+ CTD deck unit (WHOI); Sea-Bird Electronics 9+ CTD with Dual SBE3T/SBE4C temperature/conductivity sensors (WHOI); 24-bottle Rosette with 10-liter bottles (WHOI); Sea-Bird Electronics 43 oxygen sensor (WHOI); WET Labs ECO FLNTU, measuring chlorophyll fluorescence with excitation at 470 nm and emission at 695 nm and volume scattering function at 140° and 700 nm (Perry); WET Labs C-Star transmissometer, measuring transmission at 653 nm (s/n 284, loaned to Perry; s/n 1090, Perry); WET Labs CDOM ECO fluorometer – measuring colored dissolved organic material (CDOM) fluorescence with excitation at 370 nm and emission at 460 nm (loaned to Perry); Seapoint Turbidity Meter measuring broad angle side scattering over a wide angle (15 – 150º) at 880 nm (WHOI); Biospherical Instruments underwater QSP2300 sensor, measuring scalar underwater photosynthetically active radiation (PAR; Perry); Biospherical Instruments surface QSR-240 Quantum Scalar Reference Sensor providing surface photosynthetically active radiation (SPAR; WHOI). For more details, see sensor set up and instrument calibration factors document: Knorr19303_PsaReport.txt CTD data are reported as cast number and not as station number. CTD Rosette system profiled at 0.5 m s-1 between the surface and 200 m, and at 1 m s-1 below 200 m. On CTD casts 16, 17, 59, 61, 63, 82, 109 and 124, the pump associated with the Oxygen SBE43 sensor failed, resulting in partial or total removal of oxygen data from the dataset (parameter name O2_cal). For those casts with pump failure, temperature and salinity data from the second CT sensors were used. WET Labs C-Star s/n 284 was used on cruise B200804 (deployment cruise on R/S Bjarni Saemundsson) and the first part of KN19303 (process cruise). It flooded and was replaced with C-Star s/n 1090 for the remainder of the process cruise (it was also use on the two additional R/S Bjarni Saemundsson cruises B200809 and B200810). Data (parameter name beam_cp) associated with malfunctioning and flooded C-Star s/n 284 have been removed from following casts: 13, 25–30 and 43. The parameter name beamc_id indicates which C-Star was used (s/n 284 or 1090). Cross calibration of C-Stars is discussed below, under Data Processing. Seapoint Turbidity Meter could not be configured on the CTD Rosette system after the exchange of C-Star sensors; therefore, data from that sensor (parameter name ss880_raw) are not available after CTD cast 30. Processing Description Temperature and salinity (parameter names temp and sal): The CTD had dual CT sensors. For profiles where the two sensors agreed, a 51- (2.1 s) point median filter was applied to the mean of the two sensors. For profiles or regions of the profile where the two sensors disagreed, data from the sensor with the lesser variability was chosen and a 101-point (4.2 s) median filter was applied to only that sensor. Further manual smoothing was performed for a few casts. For more details on temperature and salinity processing, see Ship_TS_despiking-NAB08.pdf. Dissolved oxygen, O2 (parameter name O2_cal): The sensor was calibrated immediately before the cruise. The factory calibration was applied to SBE43 oxygen sensor output and data were converted to µmol kg-1 and aligned with Winkler O2 measurements (included in KN193-03 bottle file). A time-dependent quadratic correction was applied to the SBE data, with resulting measurement error of 3.2 µmol kg-1. For more details, see Oxygen_Calibration-NAB08.pdf. Particulate attenuation coefficient, cp (parameter name beam_cp): The factory calibration was used to convert C-Star s/n 1090 voltage to particulate attenuation coefficient, cp, m-1); the calibration factor did not change between pre-cruise and post-cruise factory calibration. C-Star s/n 284 was cross calibrated with C-Star s/n 1090 through a series of simultaneous ship/Biofloat48 calibration profiles. The final product contains cross-calibrated cp coefficients for all three C-Stars. Complete details of the transmissometer intercalibration procedure are in C-Star calibration report (C-Star_Calibration-NAB08.pdf). Particulate organic carbon (POC) derived from cp (parameter name POC_cp): A linear regression was calculated to convert cp to POC using POC measurements from bottle samples (KN19303_bottle_file.mat). The cp values used in the regression were median cp values from a 30-s stationary period immediately before the bottle was fired; only data from C-Star s/n 1090 were used in the regression. These data are reported in the accompanying bottle file (KN19303_bottle.mat). The regression used to derive the POC product (poc_cp) from cp is: POC (mg C m-3) = cp (m-1) * 408 (mg C m-2) – 10 (mg C m-3); r2 = 0.80, This relationship is empirical and it should not be applied to the other cruises without independent verification. For more details, see POC_cp_bbp_Calibration-NAB08.pdf. Particulate backscattering coefficient, bbp (parameter name bbp700): Backscattering voltage was converted to ? at 140° by subtracting dark voltages (median in-situ dark voltage, 0.078 V) and multiplying by factory calibration scale factors, modified based on measurements and calculations of Sullivan et al. (subm.). The calibration factor did not change between pre-cruise and post-cruise factory calibration. ? at 140° was converted to bbp (m-1) by subtracting ? of seawater (Zhang et al., 2009) and multiplying by 2?? (where ? = 1.132). See calibration report for more details: Backscatter_Calibration-NAB08.pdf. Particulate organic carbon (POC) derived from bbp (parameter name POC_bbp): Ship-based bbp estimates over the entire experiment were ~20% higher on the CTD downcasts than the upcasts. This systematic difference may be due to the optical properties of aggregates (Briggs, 2010), but remains under investigation. Downcast data only are included for the CTD profiles (parameter name bbp700). Because of the systematic difference between bbp on the downcast vs. upcast and ~30-s stationary period, the relationship between stationary bbp and POC data in the bottle file cannot be directly applied to calculate downcast bbp to POC. Hence, the regression equation below was used to generate the POC product from downcast data: an 11-point (11 s) median filter was applied to the downcast bbp data, and bbp data were interpolated in density space to align downcast and upcast bbp. This data set was used to produce a regression for application to downcast bbp: POC (mg C m-3) = bbp_downcast (m-1) * 35800 (mg C m-2) – 16.2 (mg C m-3); r2 = 0.81. This relationship is empirical and it should not be applied to the other cruises without independent verification. For more details, see POC_cp_bbp_Calibration-NAB08.pdf. Chlorophyll concentration (parameter name chl_a_derived): Chlorophyll fluorescence (parameter name chl_raw) is reported as the raw instrument voltage output minus dark counts (median in situ dark voltage = 0.083 volts). An algorithm to convert chlorophyll fluorescence to chlorophyll concentration (mg chlorophyll m-3) was developed for the R/V Knorr data using an empirical relationship between extracted chlorophyll and the following in-situ measurements: chlorophyll fluorescence, temperature, PAR, depth and time. This relationship is empirical and it should not be applied to the other cruise data without independent verification. For more details see Chlorophyll Calibration document (Chlorophyll_Calibration-NAB08.pdf) and Bagniewski et al. (subm.). Matlab code for calculation of this chlorophyll proxy: chlorophyll_proxy_calculation_NAB08.m. Surface PAR (parameter name SPAR): Calibration coefficients for surface PAR sensor were incorrect in the original SBE configuration file. The incorrect coefficients were removed in the post processing and correct coefficients were applied to the data. The sensor was new and calibrated before the cruise. For more details, see Radiometry_and_PAR_Calibration-NAB08.pdf. Water column photosynthetically active radiation (parameter name PAR): Reported values for water column PAR might have a positive bias of ~0.08 µmol photon m^-2 s^-1 based on discrepancies between factory calibration sheet and value used in the SBE configuration file. This error is very small and usually less than or similar to calibration associated error, as noted in the factory calibrations. For more details, see Radiometry_and_PAR_Calibration-NAB08.pdf. CDOM fluorescence (parameter name CDOM) is reported as raw, uncalibrated values; no calibration or dark values were available for this borrowed sensor. Broad angle sidescattering at 880 nm (parameter name ss880_raw) is reported as raw, uncalibrated values; no calibration or dark values were available for this sensor. |
B4-2008
| Website | |
| Platform | R/V Bjarni Saemundsson |
| Start Date | 2008-04-01 |
| End Date | 2008-04-06 |
| Description | Deployment cruise:
R/S Bjarni Saemundsson departed 1 April 2008 10:00 from Reykjavik to deploy 2 floats (Biofloat 47 and 48 and 4 Seagliders (SG 140, 141, 142, 143); these were all successfully deployed on 4 April 2008. Biofloat 47 failed within a few weeks of deployment; therefore its data are not reported.
CTD profiles (n=9) and water samples were collected before and after the autonomous platform deployment. R/S Bjarni Saemundsson returned to Reykjavik on 6 April 2008. Methods & Sampling CTD rosette deployed from the R/S Bjarni Saemundsson was equipped with following sensors; sensor owner is identified in parenthesis (Marine Research Institute or Perry): Sea-Bird Electronics 11+ CTD deck unit (Marine Research Institute); Sea-Bird Electronics 9+ CTD (Marine Research Institute); Sea-Bird Electronics 43 oxygen sensor (Marine Research Institute); WET Labs ECO FLNTU, measuring chlorophyll fluorescence with excitation at 470 nm and emission at 695 nm and volume scattering function at 140° and 700 nm (Perry); Biospherical Instruments underwater QSP2300 sensor, measuring scalar underwater photosynthetically active radiation (PAR; Perry). For more details, see sensor set up and instrument calibration factors document: b200804_PsaReport.txt WET Labs C-Star s/n 284 was used on cruise B200804 (deployment cruise on R/S Bjarni Saemundsson). The parameter name beamc_id indicates that C-Star s/n 284 was used for this cruise. Cross calibration of C-Stars is discussed under Data Processing. Processing Description CTD data are reported as cast number and not as station number. Temperature and salinity (parameter names temp and sal): On the R/S Bjarni Saemundsson cruises, only one CTD unit was present, so salinity and temperature were de-spiked using a 21-point (3.5 s) median filter. An additional 81-point (13 s) median filter was applied where the signal was particularly variable. For more details on temperature and salinity processing, see Ship_TS_despiking-NAB08.pdf. Dissolved oxygen, O2 (parameter name O2_uncal): The sensor was calibrated immediately before the 1 April 2008 cruise. The factory calibration was applied to SBE43 oxygen sensor voltage, with units of µmol kg-1. Although the sensor was calibrated immediately before the cruise, the absolute concentrations were not verified by Winkler oxygen. Particulate attenuation coefficient, cp (parameter name beam_cp): C-Star s/n 284 did not have a recent factory calibration. On the subsequent R/V Knorr cruise in May, it was cross calibrated with the newly calibrated C-Star s/n 1090 through a series of simultaneous ship/Biofloat48 calibration profiles. The final product contains cross-calibrated cp coefficients (m-1) for all three C-Stars. Complete details of the transmissometer intercalibration procedure are in C-Star calibration report (C-Star_Calibration-NAB08.pdf). Particulate backscattering coefficient, bbp (parameter name bbp700): Backscattering voltage was converted to ? at 140° by subtracting dark voltages (median in-situ dark voltage, 0.078 V) and multiplying by factory calibration scale factors, modified based on measurements and calculations of Sullivan et al. (subm.). The calibration factor did not change between pre-cruise and post-cruise factory calibration. ? at 140° was converted to bbp (m-1) by subtracting ? of seawater (Zhang et al., 2009) and multiplying by 2?? (where ? = 1.132). See calibration report for more details: Backscatter_Calibration-NAB08.pdf. Chlorophyll fluorescence: Chlorophyll fluorescence (parameter name chl_raw) is reported as the raw instrument voltage output minus dark voltage (median in situ dark voltage = 0.083 volts). Water column photosynthetically active radiation (PAR; parameter name par): The sensor was new and freshly calibrated before the cruise. For more details, see Radiometry_and_PAR_Calibration-NAB08.pdf. |
B9-2008
| Website | |
| Platform | R/V Bjarni Saemundsson |
| Start Date | 2008-06-02 |
| End Date | 2008-06-06 |
| Description | Rescue cruise: R/S Bjarni Saemundsson departed 2 June 2008 2030 from Reykjavik to recover Float 48 and Seaglider 143. Ten CTD casts were made and bottles samples collected for calibration of remaining Seagliders before departing study area. R/S Bjarni Saemundssonreturned to Reykjavik on 6 June 2008. Methods & Sampling CTD rosette deployed from the R/S Bjarni Saemundsson was equipped with following sensors; sensor owner is identified in parenthesis (Marine Research Institute or Perry): Sea-Bird Electronics 11+ CTD deck unit (Marine Research Institute); Sea-Bird Electronics 9+ CTD (Marine Research Institute); Sea-Bird Electronics 43 oxygen sensor (Marine Research Institute); WET Labs ECO FLNTU, measuring chlorophyll fluorescence with excitation at 470 nm and emission at 695 nm and volume scattering function at 140° and 700 nm (Perry); Biospherical Instruments underwater QSP2300 sensor, measuring scalar underwater photosynthetically active radiation (PAR; Perry). During the cast 289a, WET Labs FLNTU sensor (parameters chl_raw and bbp700) was covered with black electrical tape, which allowed dark counts to be determined in situ. For more details, see sensor set up and instrument calibration factors document: b200809_PsaReport.txt Processing Description CTD data are reported as cast number and not as station number. Temperature and salinity (parameter names temp and sal): On the R/S Bjarni Saemundsson cruises, only one CTD unit was present, so salinity and temperature were de-spiked using a 21-point (3.5 s) median filter. An additional 81-point (13 s) median filter was applied where the signal was particularly variable. For more details on temperature and salinity processing, see Ship_TS_despiking-NAB08.pdf. Dissolved oxygen, O2 (parameter name O2_uncal): The sensor was calibrated immediately before the 1 April 2008 cruise. The factory calibration was applied to SBE43 oxygen sensor voltage, with units of µmol kg-1. Although the sensor was calibrated immediately before the cruise, the absolute concentrations were not verified by Winkler oxygen. Particulate backscattering coefficient, bbp (parameter name bbp700): Backscattering voltage was converted to ? at 140° by subtracting dark voltages (median in-situ dark voltage, 0.078 V) and multiplying by factory calibration scale factors, modified based on measurements and calculations of Sullivan et al. (subm.). The calibration factor did not change between pre-cruise and post-cruise factory calibration. ? at 140° was converted to bbp (m-1) by subtracting ? of seawater (Zhang et al., 2009) and multiplying by 2?? (where ? = 1.132). See calibration report for more details: Backscatter_Calibration-NAB08.pdf. Chlorophyll fluorescence: Chlorophyll fluorescence (parameter name chl_raw) is reported as the raw instrument voltage output minus dark voltage (median in situ dark voltage = 0.083 volts). Water column photosynthetically active radiation (parameter name PAR): The sensor was new and freshly calibrated before the cruise. For more details, see Radiometry_and_PAR_Calibration-NAB08.pdf. |
B10-2008
| Website | |
| Platform | R/V Bjarni Saemundsson |
| Start Date | 2008-06-25 |
| End Date | 2008-07-01 |
| Description | Recovery cruise: R/S Bjarni Saemundsson departed 25 June 2008 0930 from Reykjavik to recover Seagliders 140, 141, 142. Before the ship departed port, SG 142 stopped communicating; hence, a survey pattern was carried out to acoustically ping for the glider but was unsuccessful in locating it. CTD casts were made (n=12) and bottles samples collected for calibration of SG 140 and 141 before they were recovered. The ship steamed to near the original deployment site (59.02º, -20.49) on 29 June 2008 to deploy two bio-optical ARGO floats for Dr. H. Claustre, LOV, France. R/S Bjarni Saemundsson returned to Reykjavik on 1 July 2008.
Methods & Sampling CTD rosette deployed from the R/S Bjarni Saemundsson was equipped with following sensors. Sensor owner is identified in parenthesis (Marine Research Institute or Perry): Sea-Bird Electronics 11+ CTD deck unit (Marine Research Institute); Sea-Bird Electronics 9+ CTD (Marine Research Institute); Sea-Bird Electronics 43 oxygen sensor (Marine Research Institute); WET Labs ECO FLNTU, measuring chlorophyll fluorescence with excitation at 470 nm and emission at 695 nm and volume scattering function at 140° and 700 nm (Perry); WET Labs C-Star transmissometer, measuring transmission at 653 nm (s/n 284, loaned to Perry); Biospherical Instruments underwater QSP2300 sensor, measuring scalar underwater photosynthetically active radiation (PAR; Perry). During the cast 302, WET Labs FLNTU sensor (parameters chl_raw and bbp700) was covered with black electrical tape, which allowed dark counts to be determined in situ. For more details, see sensor set up and instrument calibration factors document: b200810_PsaReport.txt WET Labs C-Star s/n 1090 malfunctioned on casts 290a, 291, 292 and 294. The data from these casts have been removed. The parameter name beamc_id indicates which C-Star was used (s/n 1090). Cross calibration of C-Stars is discussed under Data Processing. Processing Description CTD data are reported as cast number and not as station number. Temperature and salinity (parameter names temp and sal): On the R/S Bjarni Saemundsson cruises, only one CTD unit was present, so salinity and temperature were de-spiked using a 21-point (3.5 s) median filter. An additional 81-point (13 s) median filter was applied where the signal was particularly variable. For more details on temperature and salinity processing, see Ship_TS_despiking-NAB08.pdf. Dissolved oxygen, O2 (parameter name O2_uncal): The sensor was calibrated immediately before the 1 April cruise. The factory calibration was applied to SBE43 oxygen sensor voltage, with units of µmol kg-1. Although the sensor was calibrated immediately before the cruise, the absolute concentrations were not verified by Winkler oxygen. Particulate attenuation coefficient, cp (parameter name beam_cp): The factory calibration was used to convert C-Star s/n 1090 voltage to particulate attenuation coefficient, cp, (m-1); the calibration factor did not change between pre-cruise and post-cruise factory calibration. C-Star s/n 284 was cross calibrated with C-Star s/n 1090 through a series of simultaneous ship/Biofloat48 calibration profiles. The final product contains cross-calibrated cp coefficients for all three C-Stars. Complete details of the transmissometer intercalibration procedure are in C-Star calibration report (C-Star_Calibration-NAB08.pdf). Particulate backscattering coefficient, bbp (parameter name bbp700): Backscattering voltage was converted to ? at 140° by subtracting dark voltages (median in-situ dark voltage, 0.078 V) and multiplying by factory calibration scale factors, modified based on measurements and calculations of Sullivan et al. (subm.). The calibration factor did not change between pre-cruise and post-cruise factory calibration. ? at 140° was converted to bbp (m-1) by subtracting ? of seawater (Zhang et al., 2009) and multiplying by 2?? (where ? = 1.132). See calibration report for more details: Backscatter_Calibration-NAB08.pdf. Chlorophyll fluorescence: Chlorophyll fluorescence (parameter name chl_raw) is reported as the raw instrument voltage output minus dark voltage (median in situ dark voltage = 0.083 volts). Water column photosynthetically active radiation (parameter name PAR): The sensor was new and freshly calibrated before the cruise. For more details, see Radiometry_and_PAR_Calibration-NAB08.pdf. |
North Atlantic Bloom Experiment 2008 (NAB 2008)
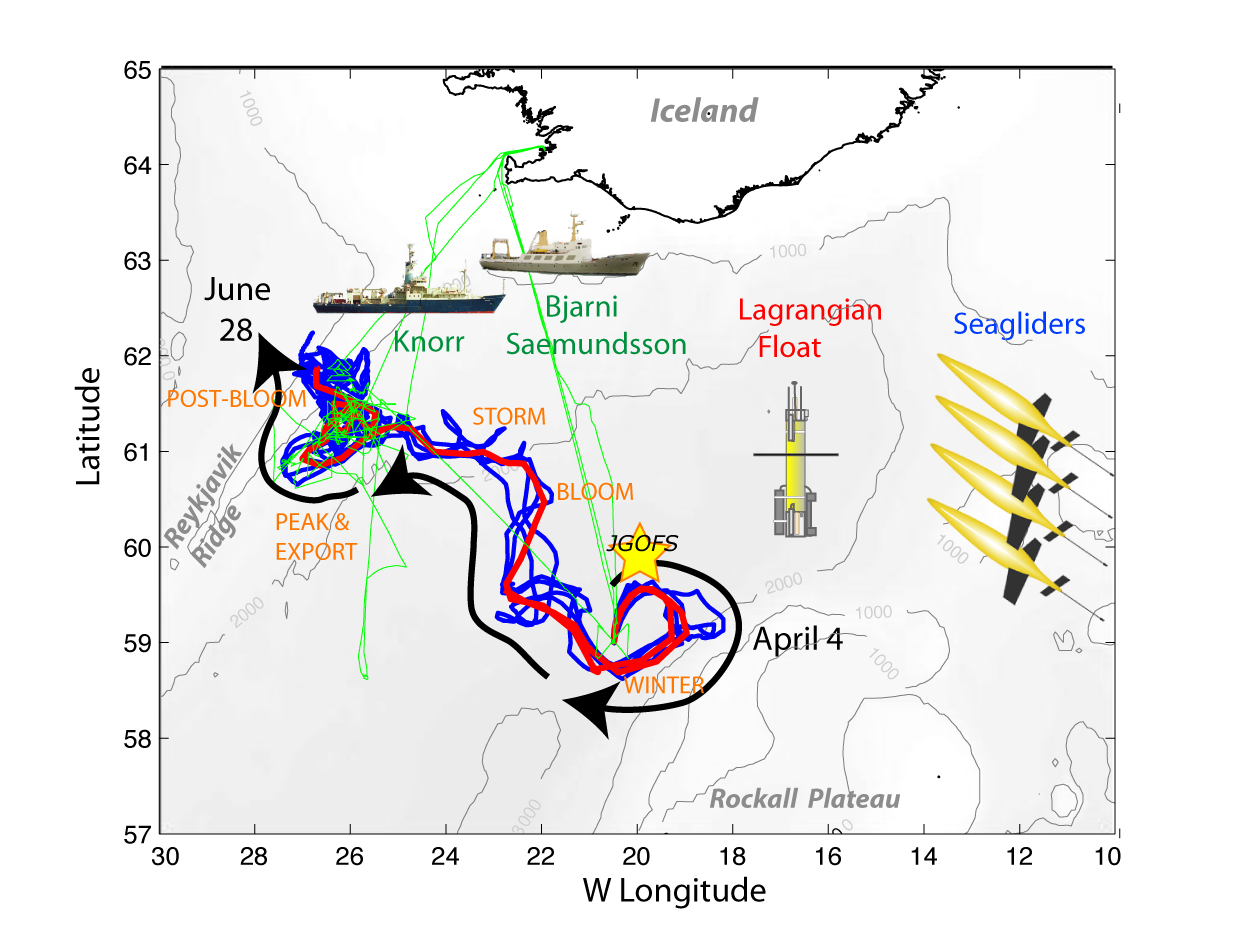
NAB2008 was a process experiment designed to study an important component of the oceanic carbon system - the North Atlantic spring bloom. The phytoplankton bloom occurring each spring in the North Atlantic, drives the uptake of carbon dioxide and is an important component of the biological pump (Bagniewski et al., 2010). Previous studies in this region have shown the importance of small temporal and spatial scales, i.e. ecosystem patchiness, during the bloom, but were restricted by the limitations of ship-based sampling. Recent advances in autonomous platforms and sensors presented an opportunity to study this important event in a new way. In addition to deployment of a diverse suite of in situ sampling devices, NAB2008 was also a test-bed for developing the strategies and knowledge needed to successfully use new methods to drive the next generation of ocean observations.
In 2008, a coordinated deployment of 1 float, 4 Seagliders and 2 research vessels sampled the evolution of the North Atlantic spring bloom along and surrounding the nearly Lagrangian path followed by the float. The autonomous measurements were continuous through the experimental period, and included CTD, chlorophyll fluorescence, optical backscatter, and oxygen on all platforms; and nitrate, optical attenuation, and various radiance measurements on the float. Velocities were determined from the vehicle motion, with the float extending to a depth of 230 meters and gliders to 1,000 meters. The autonomous vehicles were deployed, rescued, and recovered on three cruises of the Icelandic vessel Bjarni Saemundsson. A 21-day cruise of the R/V Knorr conducted more detailed measurements during the peak of the bloom in May. The R/V Knorr sampling program included optical profiles, ADCP data and analysis of water samples for nutrients, particulate organic carbon, pigments, micro-plankton composition, complemented by guest investigator analyses. Data from both ships were used to calibrate and validate the autonomous measurements.
References:
Bagniewski, W., Fennel, K., Perry, M. J., and D'Asaro, E. A. (2010) Optimizing models of the North Atlantic spring bloom using physical, chemical and bio-optical observations from a Lagrangian float, Biogeosciences Discuss., 7, pp. 8477-8520, doi:10.5194/bgd-7-8477-2010
Click on image to view full size
Ocean Carbon and Biogeochemistry (OCB)
The Ocean Carbon and Biogeochemistry (OCB) program focuses on the ocean's role as a component of the global Earth system, bringing together research in geochemistry, ocean physics, and ecology that inform on and advance our understanding of ocean biogeochemistry. The overall program goals are to promote, plan, and coordinate collaborative, multidisciplinary research opportunities within the U.S. research community and with international partners. Important OCB-related activities currently include: the Ocean Carbon and Climate Change (OCCC) and the North American Carbon Program (NACP); U.S. contributions to IMBER, SOLAS, CARBOOCEAN; and numerous U.S. single-investigator and medium-size research projects funded by U.S. federal agencies including NASA, NOAA, and NSF.
The scientific mission of OCB is to study the evolving role of the ocean in the global carbon cycle, in the face of environmental variability and change through studies of marine biogeochemical cycles and associated ecosystems.
The overarching OCB science themes include improved understanding and prediction of: 1) oceanic uptake and release of atmospheric CO2 and other greenhouse gases and 2) environmental sensitivities of biogeochemical cycles, marine ecosystems, and interactions between the two.
The OCB Research Priorities (updated January 2012) include: ocean acidification; terrestrial/coastal carbon fluxes and exchanges; climate sensitivities of and change in ecosystem structure and associated impacts on biogeochemical cycles; mesopelagic ecological and biogeochemical interactions; benthic-pelagic feedbacks on biogeochemical cycles; ocean carbon uptake and storage; and expanding low-oxygen conditions in the coastal and open oceans.
| Funding Source | Award |
|---|---|
| NSF Division of Ocean Sciences (NSF OCE) | |
| National Aeronautics & Space Administration (NASA) | |
| NSF Division of Ocean Sciences (NSF OCE) |
[ table of contents | back to top ]