Profile data from Lagrangian mixed layer float collected from Biofloat 48 deployment in the subpolar North Atlantic and Iceland Basin in 2008 (NAB 2008 project)
Project
Program
| Contributors | Affiliation | Role |
|---|---|---|
| D'Asaro, Eric | University of Washington Applied Physics Laboratory (UW APL) | Principal Investigator |
| McKee, Theresa | Woods Hole Oceanographic Institution (WHOI BCO-DMO) | BCO-DMO Data Manager |
Full-resolution sensor profile data acquired during the 51-day autonomous Lagrangian float mission that took place as part of North Atlantic Bloom Experiment 2008.
The daily cycle of NAB08 float consisted of a sequence of profiling and drifting. Parameter name "cycle" counts each cycle.
Each cycle is defined by the following sequence of modes, available with every sensor measurement as parameter name "mode": profile down (mode = 0), settle (mode = 1), drift (modes 3, 5), profile up (mode 2) and communication (GPS fix but no sensor data).
Sensor sampling intervals were different for profile modes versus settle/drift modes. For profiling (modes 0, 2), all sensors are sampled every 40-60 s, except ISUS, which is 160-240 s. For drift and settle operation (modes 1, 3, 5), the sample intervals are shown in the table below:
Dataset Sample Samples/day
Interval (s)
ctd, flntu, optodeO2 50 1,728
Ed, Lu (daylight only) 200 290
licor (daylight only) 50 1,162
cstar 200 432
seabirdO2 400 216
isus 1600 54
Sensors were sampled sequentially and rarely simultaneously. Therefore, the timebase (parameter names "julianday_yr0" and "yrday") will be different for every sensor, even for sensors with the same sample interval. An example showing drift mode sampling of a subset of the float sensors over 110 seconds is shown below.
As a convenience to the data user, each sensor dataset (except GPS and CTD data) includes interpolated CTD, location (GPS) and float mode information.
GPS coordinates are only truly accurate for the time that the float is at the surface, specifically, when the float is at a depth of < 1 m at the end of a daily “up” profile. Latitude and longitude at other times are interpolated between these daily surface GPS fixes.
Please refer to NAB08Float48SamplingMethodologyV1.pdf for additional details on the mission and sampling strategy for each of the sensors deployed on float 48.
Unless noted below, no filtering or de-spiking of float 48 sensor data has been performed.
Temperature, Potential Temperature, Salinity (parameter names temp, potemp, sal): Float 48 had two CTD sensors: one on top of the float, the other on the bottom. The CTD sensors on float 48, the R/V Knorr process cruise 193-03, the float deployment cruise on the R/V Bjarni Saemundsson and the pre- and post-cruise float sensor calibrations were compared. Formulae were found to bring them all into agreement to within 0.001 salinity using the Knorr CTD as the absolute standard. A 3 point running median filter was applied to eliminate single spikes. An algorithm to merge data from the two float CTD’s (top and bottom) were used to reduce the effect of other errors. For more details, see CTD_float_Calibration-NAB08.pdf.
Particulate attenuation coefficient cp (parameter name beam_cp): Beam transmissometers from Floats 48 (CST-1063), the R/V Knorr cruise 193 (CST-284 and CST-1090), and the two cruises on the R/V Bjarni Saemundsson (CST-284, CST-1090) were compared and rectified to yield a consistent measurement of transmittance (%) and particulate attenuation coefficient due to particles cp at 652 nm. This analysis allowed the application of a single correlation between cp and particulate organic carbon based on linear regression of cruise CTD measurements and bottle measurements of POC. For more details, see C-Star_Calibration-NAB08.pdf.
Chlorophyll fluorescence (parameter name chl_raw_float) is reported as raw instrument counts without subtraction of dark counts. Parameter name chl_raw is reported as instrument voltage output minus dark voltage (median in situ dark voltage = 0.083 volts); this parameter was intercalibrated with ship CTD, float and glider fluorometers and is reported as ship CTD volts.
Chlorophyll a from fluorescence (parameter name chl_a_derived): Comparison of the chlorophyll fluorometers on the Knorr CTD and on float 48 with extracted chlorophyll from the R/V Knorr 193-03 water samples show clear depth and time dependences. Accordingly, a linear relationship between chlorophyll and fluorescence is abandoned in favor of a more complex, albeit empirical scheme. Counts from the float 48 fluorometer are converted to chlorophyll using a dark offset and a gain that has dependences on temperature, PAR, depth and yearday, with the gain and offset adjusted so that the float best matches the extracted chlorophyll at the R/V Knorr –float calibration casts (where nearly simultaneous profiles of the R/V Knorr CTD and float 48 were performed to 250 m). The resulting float 48 chlorophyll matches the bottles from both the R/V Knorr process cruise and R/V Bjarni deployment cruises with an error of 30-50%. For more details see
Chlorophyll_Calibration-NAB08.pdf.
Dissolved oxygen (parameter names O2_cal): The Seabird SBE-43 oxygen sensor and the Aanderra Optode on float 48 both require calibration and removal of various sensor errors. The Optode is poorly calibrated in terms of dissolved oxygen, temperature and pressure. During times of low flow and a closed drogue, it can have biases exceeding 10 μmol/kg, probably due to oxygen consumption by the float. The SBE-43 exhibits mode-variable biases due to our attempts to reduce pumping energy. By inter-comparing these sensors and comparing them with the Winkler bottle samples from the R/V Knorr and SBE-43 sensor taken on calibration casts during R/V Knorr cruise 193-03, adjustments were developed to bring both float 48 oxygen sensors and the R/V Knorr CTD SBE-43 sensor into agreement and into absolute calibration to an accuracy of better than 2 μmol/kg. These corrections are applied to the float data. The best float 48 oxygen data was obtained from the SBE-43 in all float modes and the Optode in down and drift modes. The Optode data from settle and up mode still contains systematic errors. For more details, see Oxygen_Calibration-NAB08.pdf.
Nitrate (parameter names nitrate): The Satlantic in situ ultraviolet spectrophometer ISUS V3 sensor was deployed on Float 48. Post calibration of the ISUS instrument and subsequent processing of the spectrophotometric data acquired by the ISUS incorporating in situ temperature and salinity measurements to correct for the temperature-dependent, ultraviolet absorbance by the bromide ion results in a precision of duplicate nitrate measurements of 0.1μM. These nitrate concentrations were then calibrated against bottle measurements collected during the R/V Knorr process cruise (April 17 through May16) and subsequently analyzed for nitrate plus nitrite (NO3-+ NO2-) concentration. A simple linear regression was sufficient to make the ISUS nitrate concentrations (NO3ISUS) fit the bottle for nitrate plus nitrite measurements with a standard deviation of 0.6μM:
nitrate = 1.1536 x NO3ISUS + 2.6227 (r2 = 0.927, n = 53)
Comparisons with water samples taken on the R/V Bjarni Saemundsson deployment cruise are inconclusive due to high spatial variability. No obvious drift of the ISUS response with time or depth was apparent. For more details, see ISUS_Nitrate_Calibration-NAB08.pdf.
Particulate organic carbon (POC) derived from cp (parameter name POC_cp): A relationship between Ship-based cp (R/V Knorr 193-03) and bottle POC data was used to produce a regression for application to CTD downcast cp. The ship and float WET Labs C-Star beam transmissometers were intercalibrated (see above). Therefore, the same cp-POC regression as used for the R/V Knorr 193-03 cruise can applied to float 48 cp data (parameter name cstar.beamc):
POC (mg C m-3) = cp (m-1) * 408 (mg C m-2) – 10 (mg C m-3); r2 = 0.80,
This relationship is empirical and it should not be applied to the other cruises without independent verification. For more details, see the datasets associated with KN193-03 and POC_cp_bbp_Calibration-NAB08.pdf.
Particulate backscattering coefficient, bbp (parameter name bbp700): Backscattering voltage was converted to Β at 140° by subtracting a factory-determined dark voltage and multiplying by a factory calibration scale factor, modified based on measurements and calculations of Sullivan et al. (subm.), parameter name flntu.beta700. The calibration factor did not change significantly between pre-cruise and post-cruise factory calibration. Β at 140° was converted to bbp (m-1) by subtracting Β of seawater (Zhang et al., 2009) and multiplying by 2π (where Β = 1.132) to produce parameter name flntu.bbp700cal0. For the float 48, the resulting bbp700cal0 value was adjusted to fit the R/V Knorr FLNTU, producing flntu.bbp700 using the following intercalibration equation:
flntu.bbp700 = 1.040 * flntu.bbp700cal0 – 0.000790
See calibration report for more details: Backscatter_Calibration-NAB08.pdf.
Particulate organic carbon (POC) derived from bbp (parameter name POC_bbp): A relationship between Ship-based bbp (R/V Knorr 193-03) and bottle POC data was used to produce a regression for application to CTD downcast bbp. The ship and float WET Labs FLNTU backscattering meters were intercalibrated (see above). Therefore, the same bbp-POC regression equation as used for the R/V Knorr can be applied to Float 48 bbp(700) data (parameter name flntu.bbp700).
POC (mg C m-3) = bbp(700) (m-1) * 35800 (mg C m-2) – 16.2 (mg C m-3); r2 = 0.81.
This relationship is empirical and it should not be applied to the other cruises without independent verification. For more details, see the datasets associated with KN193-03 and POC_cp_bbp_Calibration-NAB08.pdf.
In situ photosynthetically active radiation (PAR; parameter name PAR): Using factory-supplied calibration factors, the LI-COR 192SA PAR sensor has a stated NIST-traceable accuracy of +/- 5% in air, stability of less than +/- 2%. Reported values for in situ PAR from the float 48 LI-COR 192-SA sensor do not match those computed by spectral integration from the TriOS hyperspectral downwelling irradiance (ACC) sensor (parameter name acc.par); a systematic bias exists between the two PAR values. Further, using matchups when the float was at the surface, neither LI-COR PAR or TriOS PAR match PAR values computed from various R/V Knorr 193-03 PAR sensors. Shading of the LI-COR sensor is possible by the top-mounted CTD, GPS/Argos antennas, and float ring supports; effects of this shading has not been quantified. The effects of self-shading due to the 1 m square drogue deployed during drift mode have not yet been quantified. For more details, see Radiometry_and_PAR_Calibration-NAB08.pdf.
In situ hyperspectral downwelling plane irradiance Ed(λ ) and hyperspectral upwelling radiance Lu(λ ) , parameter names Ed and Lu, respectively): The TriOS ACC Ed sensor measured hyperspectral downwelling plane irradiance from 320-950 nm. The TriOS ARC Lu sensor measured upwelling radiance from 320-950 nm. Both sensors sampled at ~3.3 nm spectral resolution and 0.3 nm spectral accuracy. From the raw 12 bit digital values, calibrated irradiance Ed(λ ) (W m-2 nm-1) and radiance Lu(λ ) (W m-2 sr-1nm-1) was computed from the ACC and ARC sensors, respectively, using pre-cruise factory calibration coefficients and the equations provided by TriOS (TriOS 2004). ACC Ed and ARC Lu sensor measurement wavelengths are not identical; no spectral interpolation has been performed. Two data quality parameters are available: tilt and qflag. The parameter “tilt” indicates the tilt of the sensor (and float) in degrees from vertical, while qflag indicates data quality: 1 = acceptable, 0 = biofouling suspect. The ACC Ed sensor appears to be biofouled during days 120 – 142; while no biofouling correction has been applied to the radiometric data, qflag is set to zero during this time. Shading of the ACC (Ed(λ )) by the top-mounted CTD, GPS and Argos antennas, ring supports is possible; effects of this shading have not been quantified but will appear as variability in the measurements rather than bias. The effects of self-shading due to the 1 m square drogue deployed during drift mode have not yet been quantified. For more details, see Radiometry_and_PAR_Calibration-NAB08.pdf.
* The float suffered a software failure on day 104. From approximately yearday 104.124 to 104.685, float 48 drifted at the surface; no data was collected during this time. Prior to yearday 104.124, only reduced temporal resolution (“Quicklook”) sensor data is available for float 48 sensors, except the CTD where full resolution data is available. After yearday 104.685, full resolution data is available for all sensors.During the first 2 days of the mission (yeardays 95, 96) Float 48 completed two cycles per day.
* Biofouling considerations: Pumped seawater output from the lower conductivity cell, containing a biocide, periodically flushed the up-facing C-Star transmitter pressure window before each measurement. Pumped seawater output from the lower conductivity cell, containing a biocide, was used for ISUS nitrate measurement. The FLNTU chlorophyll fluorometer & backscattering sensor included a copper shutter with rubber wiper which was used to protect against biofouling. The ACC Ed sensor was biofouled during days 120 – 142; no biofouling correction has been applied to Ed data.
* The MLFII floats used in NAB08 will almost certainly spin about their vertical axis. The drogues have a pinwheel aspect to them when retracted during profiling. In another experiment where an MLFII float was equipped with an accelerometer, the float spun with a rotation period during profiling of about 80s. During drift mode when the drogue is deployed, the float will also spin, with the spin rate probably more irregular and depending strongly on the turbulence levels. A spin rate of 1 RPM would not be unusual.
Related files and references:
[Include any useful supporting documents; e.g. separate files or published papers with description of sampling and analytical methodology]
gps-float48-2010-10-14-v8.mat
ctd-float48-2010-10-14-v8.mat
ed-float48-2010-10-14-v8.mat
lu-float48-2010-10-14-v8.mat
licor-float48-2010-10-14-v8.mat
ctsar-float48-2010-10-14-v8.mat
flntu-float48-2010-10-14-v8.mat
optodeO2-float48-2010-10-14-v8.mat
seabirdO2-float48-2010-10-14-v8.mat
isus-float48-2010-10-14-v8.mat
NAB08Float48SamplingMethodologyV1.pdf
Calibration reports:
CTD_float_Calibration-NAB08.pdf
C-Star Calibration-NAB08.pdf
Chlorophyll_Calibration-NAB08.pdf
Oxygen_Calibration-NAB08.pdf
ISUS_Nitrate _Calibration-NAB08.pdf
POC_cp_bbp_Calibration-NAB08.pdf
Backscatter_Calibration-NAB08.pdf
Phytoplankton_Carbon-NAB08.pdf Radiometry_and_PAR_Calibration-NAB08.pdf
References:
Garcia, H. E. and L. I. Gordon, 1992. Oxygen solubility in seawater: Better fitting equations. Limnology & Oceanography, Vol. 37 (6), 1307-1312.
TriOS, 2004. RAMSES hyperspectral radiometers manual, release: 2004-08-16.
Sullivan, J. M., M. S. Twardowski, J. R. V. Zaneveld and C. C. Moore. In-water measurement of optical backscattering at fixed angles. Submitted to Applied Optics.
Zhang, X., L. Hu and M. He. 2009. Scattering by pure seawater: Effect of salinity. Optics Express 17 (7), 5698-5710.
Version: 15 October 2008
| File |
|---|
Biofloat_48_profiles_Biofloat_48.csv (Comma Separated Values (.csv), 1.36 KB) MD5:ca9ab6e48f75c3899701346a8bf5f481 version 17 February 2011 PI: Eric D'Asaro (University of Washington) Biofloat_48 Lagrangian float data |
| Parameter | Description | Units |
| data_type | sampling method - instrument type | text |
| start_date | date sampling begins | YYYYMMDD |
| start_time | time sampling begins | HHMM |
| end_date | date sampling ends | YYYYMMDD |
| end_time | time sampling ends | HHMM |
| data_link | link to data object in the BCO-DMO data system | text |
| Dataset-specific Instrument Name | Aanderaa Oxygen Optodes |
| Generic Instrument Name | Aanderaa Oxygen Optodes |
| Generic Instrument Description | Aanderaa Oxygen Optodes are instrument for monitoring oxygen in the environment. For instrument information see the Aanderaa Oxygen Optodes Product Brochure. |
| Dataset-specific Instrument Name | CTD Sea-Bird 41 |
| Generic Instrument Name | CTD Sea-Bird 41 |
| Generic Instrument Description | The Sea-Bird SBE 41 CTD module was originally developed in 1997 for integration with sub-surface oceanographic floats. It uses MicroCAT Temperature, Conductivity, and Pressure sensors. |
| Dataset-specific Instrument Name | Global Positioning System Receiver |
| Generic Instrument Name | Global Positioning System Receiver |
| Generic Instrument Description | The Global Positioning System (GPS) is a U.S. space-based radionavigation system that provides reliable positioning, navigation, and timing services to civilian users on a continuous worldwide basis. The U.S. Air Force develops, maintains, and operates the space and control segments of the NAVSTAR GPS transmitter system. Ships use a variety of receivers (e.g. Trimble and Ashtech) to interpret the GPS signal and determine accurate latitude and longitude. |
| Dataset-specific Instrument Name | Hyperspectral Radiometer TriOS ACC |
| Generic Instrument Name | Hyperspectral Radiometer TriOS ACC |
| Generic Instrument Description | TriOS ACC Hyperspectral Radiometer Sensor |
| Dataset-specific Instrument Name | Hyperspectral Radiometer TriOS ARC |
| Generic Instrument Name | Hyperspectral Radiometer TriOS ARC |
| Generic Instrument Description | TriOS ARC Hyperspectral Radiometer Sensor |
| Dataset-specific Instrument Name | ISUS Nitrate sensor |
| Generic Instrument Name | ISUS Nitrate sensor |
| Generic Instrument Description | The Satlantic ISUS nitrate sensor is an in-situ UV absorption sensor which calculates nitrate concentration from the seawater spectrum. The ISUS V2 has a 1cm path length, a 200-400 nm wavelength range., and is depth rated to 1000 m. Satlantic's ISUS V3 nitrate sensor uses advanced UV absorption technology to measure nitrate concentration in real-time. |
| Dataset-specific Instrument Name | Lagrangian Float |
| Generic Instrument Name | Lagrangian Float |
| Dataset-specific Description | The 2008 North Atlantic Bloom Experiment (NAB08) employed a “Lagrangian float”, custom built at the University of Washington Applied Physics Laboratory. (D’Asaro, 2003, Performance of Lagrangian Floats, Journal of Atmospheric and Oceanic Technology, Vol. 20, 896-911). |
| Generic Instrument Description | Built at the University of Washington Applied Physics Laboratory, the Lagrangian Float is not an ARGO float. It is primarily designed to accurately follow the three-dimensional motion of water parcels within the mixed layer, through a combination of neutral buoyancy and high drag provided by a one meter diameter black drogue. Typical buoyancies of a few grams result in vertical velocities relative to the water of a few mm/s, small compared to the cm/s turbulent velocities in the mixed layer. The float’s motion within the mixed layer thus closely imitates that of a planktonic organism. The float can also profile vertically. It sends data and receives commands using the Iridium satellite system. The float is designed to accommodate a wide variety of sensors. |
| Dataset-specific Instrument Name | LI-COR LI-192 PAR Sensor |
| Generic Instrument Name | LI-COR LI-192 PAR Sensor |
| Generic Instrument Description | The LI-192 Underwater Quantum Sensor (UWQ) measures underwater or atmospheric Photon Flux Density (PPFD) (Photosynthetically Available Radiation from 360 degrees) using a Silicon Photodiode and glass filters encased in a waterproof housing. The LI-192 is cosine corrected and features corrosion resistant, rugged construction for use in freshwater or saltwater and pressures up to 800 psi (5500 kPa, 560 meters depth). Typical output is in um s-1 m-2. The LI-192 uses computer-tailored filter glass to achieve the desired quantum response. Calibration is traceable to NIST. The LI-192 serial numbers begin with UWQ-XXXXX. LI-COR has been producing Underwater Quantum Sensors since 1973.
These LI-192 sensors are typically listed as LI-192SA to designate the 2-pin connector on the base of the housing and require an Underwater Cable (LI-COR part number 2222UWB) to connect to the pins on the Sensor and connect to a data recording device.
The LI-192 differs from the LI-193 primarily in sensitivity and angular response.
193: Sensitivity: Typically 7 uA per 1000 umol s-1 m-2 in water. Azimuth: < ± 3% error over 360° at 90° from normal axis. Angular Response: < ± 4% error up to ± 90° from normal axis.
192: Sensitivity: Typically 4 uA per 1000 umol s-1 m-2 in water. Azimuth: < ± 1% error over 360° at 45° elevation. Cosine Correction: Optimized for underwater and atmospheric use.
(www.licor.com) |
| Dataset-specific Instrument Name | SBE 43 Dissolved Oxygen Sensor |
| Generic Instrument Name | Sea-Bird SBE 43 Dissolved Oxygen Sensor |
| Generic Instrument Description | The Sea-Bird SBE 43 dissolved oxygen sensor is a redesign of the Clark polarographic membrane type of dissolved oxygen sensors. more information from Sea-Bird Electronics |
| Dataset-specific Instrument Name | Wet Labs CSTAR Transmissometer |
| Generic Instrument Name | WET Labs {Sea-Bird WETLabs} C-Star transmissometer |
| Generic Instrument Description | The C-Star transmissometer has a novel monolithic housing with a highly integrated opto-electronic design to provide a low cost, compact solution for underwater measurements of beam transmittance. The C-Star is capable of free space measurements or flow-through sampling when used with a pump and optical flow tubes. The sensor can be used in profiling, moored, or underway applications. Available with a 6000 m depth rating.
More information on Sea-Bird website: https://www.seabird.com/c-star-transmissometer/product?id=60762467717 |
Biofloat_48
| Website | |
| Platform | Biofloat 48 |
| Start Date | 2008-04-04 |
| End Date | 2008-05-25 |
| Description | See document NAB08Float48SamplingMethodologyV1.pdf for complete information on Biofloat 48's modes, cycles, and sampling intervals for each sensor. BioFloat 48 was a Lagrangian float deployed during cruise B4-2008 of the vessel R/S Bjarni Saemundsson. |
North Atlantic Bloom Experiment 2008 (NAB 2008)
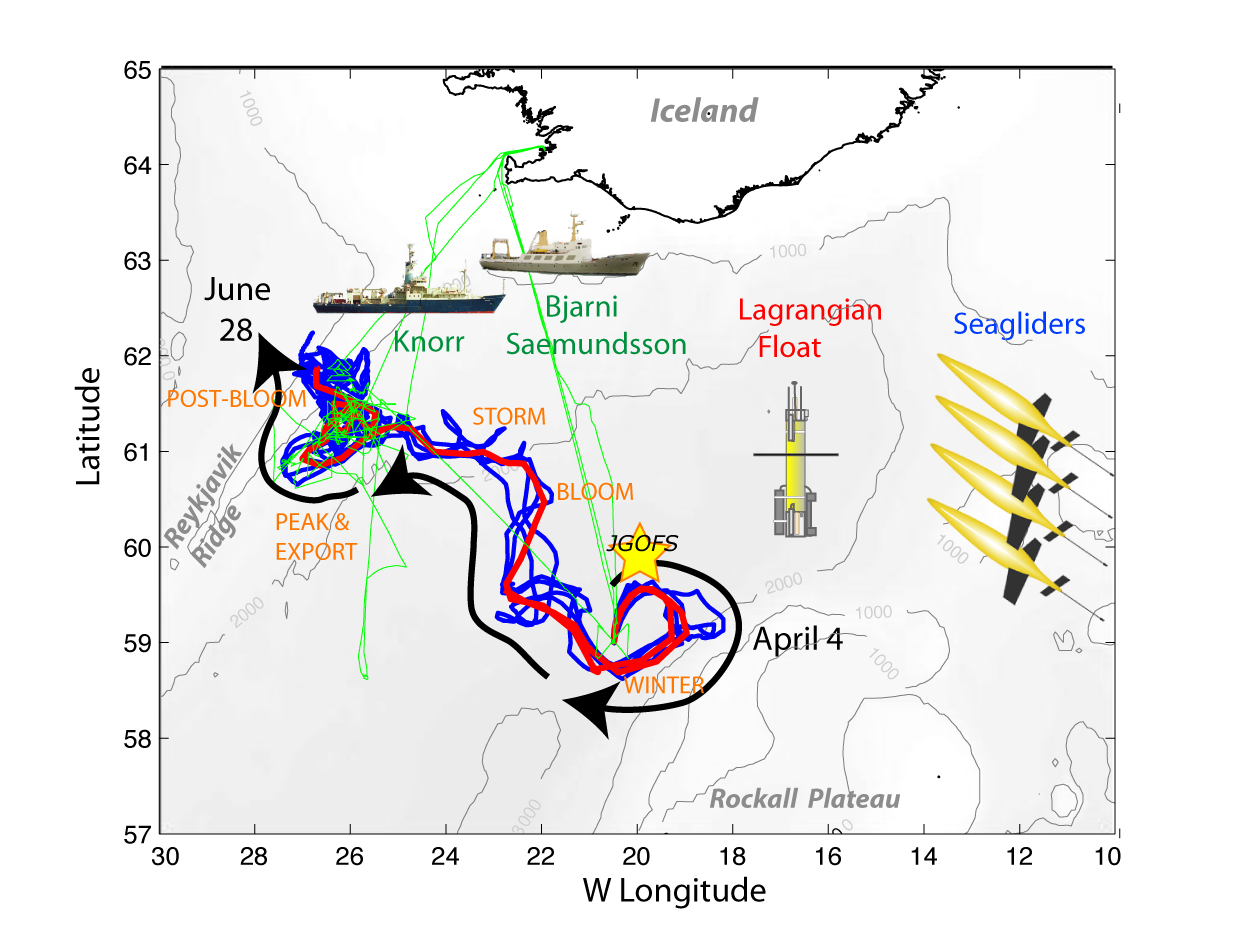
NAB2008 was a process experiment designed to study an important component of the oceanic carbon system - the North Atlantic spring bloom. The phytoplankton bloom occurring each spring in the North Atlantic, drives the uptake of carbon dioxide and is an important component of the biological pump (Bagniewski et al., 2010). Previous studies in this region have shown the importance of small temporal and spatial scales, i.e. ecosystem patchiness, during the bloom, but were restricted by the limitations of ship-based sampling. Recent advances in autonomous platforms and sensors presented an opportunity to study this important event in a new way. In addition to deployment of a diverse suite of in situ sampling devices, NAB2008 was also a test-bed for developing the strategies and knowledge needed to successfully use new methods to drive the next generation of ocean observations.
In 2008, a coordinated deployment of 1 float, 4 Seagliders and 2 research vessels sampled the evolution of the North Atlantic spring bloom along and surrounding the nearly Lagrangian path followed by the float. The autonomous measurements were continuous through the experimental period, and included CTD, chlorophyll fluorescence, optical backscatter, and oxygen on all platforms; and nitrate, optical attenuation, and various radiance measurements on the float. Velocities were determined from the vehicle motion, with the float extending to a depth of 230 meters and gliders to 1,000 meters. The autonomous vehicles were deployed, rescued, and recovered on three cruises of the Icelandic vessel Bjarni Saemundsson. A 21-day cruise of the R/V Knorr conducted more detailed measurements during the peak of the bloom in May. The R/V Knorr sampling program included optical profiles, ADCP data and analysis of water samples for nutrients, particulate organic carbon, pigments, micro-plankton composition, complemented by guest investigator analyses. Data from both ships were used to calibrate and validate the autonomous measurements.
References:
Bagniewski, W., Fennel, K., Perry, M. J., and D'Asaro, E. A. (2010) Optimizing models of the North Atlantic spring bloom using physical, chemical and bio-optical observations from a Lagrangian float, Biogeosciences Discuss., 7, pp. 8477-8520, doi:10.5194/bgd-7-8477-2010
Click on image to view full size
Ocean Carbon and Biogeochemistry (OCB)
The Ocean Carbon and Biogeochemistry (OCB) program focuses on the ocean's role as a component of the global Earth system, bringing together research in geochemistry, ocean physics, and ecology that inform on and advance our understanding of ocean biogeochemistry. The overall program goals are to promote, plan, and coordinate collaborative, multidisciplinary research opportunities within the U.S. research community and with international partners. Important OCB-related activities currently include: the Ocean Carbon and Climate Change (OCCC) and the North American Carbon Program (NACP); U.S. contributions to IMBER, SOLAS, CARBOOCEAN; and numerous U.S. single-investigator and medium-size research projects funded by U.S. federal agencies including NASA, NOAA, and NSF.
The scientific mission of OCB is to study the evolving role of the ocean in the global carbon cycle, in the face of environmental variability and change through studies of marine biogeochemical cycles and associated ecosystems.
The overarching OCB science themes include improved understanding and prediction of: 1) oceanic uptake and release of atmospheric CO2 and other greenhouse gases and 2) environmental sensitivities of biogeochemical cycles, marine ecosystems, and interactions between the two.
The OCB Research Priorities (updated January 2012) include: ocean acidification; terrestrial/coastal carbon fluxes and exchanges; climate sensitivities of and change in ecosystem structure and associated impacts on biogeochemical cycles; mesopelagic ecological and biogeochemical interactions; benthic-pelagic feedbacks on biogeochemical cycles; ocean carbon uptake and storage; and expanding low-oxygen conditions in the coastal and open oceans.
| Funding Source | Award |
|---|---|
| NSF Division of Ocean Sciences (NSF OCE) | |
| NSF Division of Ocean Sciences (NSF OCE) |
[ table of contents | back to top ]