CTD bottle data summary from R/V New Horizon cruise NH1008 in Monterey Bay, near MBARI buoy M1 (36.747?N, 122.022?W); 2010 (GATEKEEPERS project)
Project
| Contributors | Affiliation | Role |
|---|---|---|
| Checkley, David M. | University of California-San Diego Scripps (UCSD-SIO) | Principal Investigator, Contact |
| Dagg, Michael | Louisiana Universities Marine Consortium (LUMCON) | Co-Principal Investigator |
| Jackson, George A. | Texas A&M University (TAMU) | Co-Principal Investigator |
| Gegg, Stephen R. | Woods Hole Oceanographic Institution (WHOI BCO-DMO) | BCO-DMO Data Manager |
CTD - Bottle Summary
CTD Bottle Data - avg, stdev,min and max values at bottle firings for various parameters
* Sea-Bird SBE 9 Data File:
* FileName = C:CTDCheckley�35.hex
* Software Version Seasave V 7.20b
* Temperature SN = 4308
* Conductivity SN = 2319
* Number of Bytes Per Scan = 44
* Number of Voltage Words = 5
* Number of Scans Averaged by the Deck Unit = 1
* Append System Time to Every Scan
* System UpLoad Time = Jul 19 2010 06:04:19
* NMEA Latitude = 36 39.85 N
* NMEA Longitude = 122 01.96 W
* NMEA UTC (Time) = Jul 19 2010 06:04:22
* Store Lat/Lon Data = Append to Every Scan
** R/V New Horizon
** NH1008
# interval = seconds: 0.0416667
# start_time = Jul 19 2010 06:04:22
# ?xml version="1.0" encoding="UTF-8"?
# Sensors count="15"
# sensor Channel="1"
# !-- Frequency 0, Temperature --
# TemperatureSensor SensorID="55"
# SerialNumber 4308 SerialNumber
# CalibrationDate 26-Apr-2010 CalibrationDate
# UseG_J 1 UseG_J
# A 4.36407076e-003 A
# B 6.45448128e-004 B
# C 2.27855611e-005 C
# D 1.92340747e-006 D
# F0_Old 1000.000 F0_Old
# G 4.36387038e-003 G
# H 6.45235808e-004 H
# I 2.27528596e-005 I
# J 1.92187718e-006 J
# F0 1000.000 F0
# Slope 1.00000000 Slope
# Offset 0.0000 Offset
# TemperatureSensor
# sensor
# sensor Channel="2"
# !-- Frequency 1, Conductivity --
# ConductivitySensor SensorID="3"
# SerialNumber 2319 SerialNumber
# CalibrationDate 12-Jun-09 CalibrationDate
# UseG_J 1 UseG_J
# !-- Cell const and series R are applicable only for wide range sensors. --
# SeriesR 0.0000 SeriesR
# CellConst 2000.0000 CellConst
# Coefficients equation="0"
# A 0.00000000e+000 A
# B 0.00000000e+000 B
# C 0.00000000e+000 C
# D 0.00000000e+000 D
# M 0.0 M
# CPcor -9.57000000e-008 CPcor
# Coefficients
# Coefficients equation="1"
# G -1.03211898e+001 G
# H 1.50018726e+000 H
# I -3.82697724e-004 I
# J 1.04707946e-004 J
# CPcor -9.57000000e-008 CPcor
# CTcor 3.2500e-006 CTcor
# Coefficients
# Slope 1.00000000 Slope
# Offset 0.00000 Offset
# ConductivitySensor
# sensor
# sensor Channel="3"
# !-- Frequency 2, Pressure, Digiquartz with TC --
# PressureSensor SensorID="45"
# SerialNumber 0569 SerialNumber
# CalibrationDate 09-OCT-08 CalibrationDate
# C1 -4.261906e+004 C1
# C2 -3.648911e-001 C2
# C3 1.474535e-002 C3
# D1 3.768543e-002 D1
# D2 0.000000e+000 D2
# T1 3.044473e+001 T1
# T2 -4.107907e-004 T2
# T3 3.624599e-006 T3
# T4 1.375951e-008 T4
# Slope 1.00000000 Slope
# Offset 0.00000 Offset
# T5 0.000000e+000 T5
# AD590M 1.286170e-002 AD590M
# AD590B -8.288260e+000 AD590B
# PressureSensor
# sensor
# sensor Channel="4"
# !-- Frequency 3, Temperature, 2 --
# TemperatureSensor SensorID="55"
# SerialNumber 4476 SerialNumber
# CalibrationDate 26-Apr-2010 CalibrationDate
# UseG_J 1 UseG_J
# A 4.33254179e-003 A
# B 6.34742502e-004 B
# C 2.08458165e-005 C
# D 1.83956740e-006 D
# F0_Old 1000.000 F0_Old
# G 4.33235170e-003 G
# H 6.34536082e-004 H
# I 2.08144943e-005 I
# J 1.83816873e-006 J
# F0 1000.000 F0
# Slope 1.00000000 Slope
# Offset 0.0000 Offset
# TemperatureSensor
# sensor
# sensor Channel="5"
# !-- Frequency 4, Conductivity, 2 --
# ConductivitySensor SensorID="3"
# SerialNumber 1880 SerialNumber
# CalibrationDate 11-Mar-10 CalibrationDate
# UseG_J 1 UseG_J
# !-- Cell const and series R are applicable only for wide range sensors. --
# SeriesR 0.0000 SeriesR
# CellConst 2000.0000 CellConst
# Coefficients equation="0"
# A 0.00000000e+000 A
# B 0.00000000e+000 B
# C 0.00000000e+000 C
# D 0.00000000e+000 D
# M 0.0 M
# CPcor -9.57000000e-008 CPcor
# Coefficients
# Coefficients equation="1"
# G -4.13035335e+000 G
# H 5.04469106e-001 H
# I -6.68952597e-004 I
# J 5.84538832e-005 J
# CPcor -9.57000000e-008 CPcor
# CTcor 3.2500e-006 CTcor
# Coefficients
# Slope 1.00000000 Slope
# Offset 0.00000 Offset
# ConductivitySensor
# sensor
# sensor Channel="6"
# !-- A/D voltage 0, Transmissometer, Chelsea/Seatech/Wetlab CStar --
# TransChelseaSeatechWetlabCStarSensor SensorID="59"
# SerialNumber CTS492DR SerialNumber
# CalibrationDate 1 MARCH 2010 CalibrationDate
# M 19.3810 M
# B -1.1630 B
# PathLength 0.250 PathLength
# TransChelseaSeatechWetlabCStarSensor
# sensor
# sensor Channel="7"
# !-- A/D voltage 1, Oxygen, SBE 43 --
# OxygenSensor SensorID="38"
# SerialNumber 0255 SerialNumber
# CalibrationDate May, 10 2010 CalibrationDate
# Use2007Equation 1 Use2007Equation
# CalibrationCoefficients equation="0"
# !-- Coefficients for Owens-Millard equation. --
# Boc 0.0000 Boc
# Soc 0.0000e+000 Soc
# offset 0.0000 offset
# Pcor 0.00e+000 Pcor
# Tcor 0.0000 Tcor
# Tau 0.0 Tau
# CalibrationCoefficients
# CalibrationCoefficients equation="1"
# !-- Coefficients for Sea-Bird equation - SBE calibration in 2007 and later. --
# Soc 0.5762 Soc
# offset -0.5123 offset
# A -3.4352e-003 A
# B 1.1172e-004 B
# C -2.1729e-006 C
# D0 2.5826e+000 D0
# D1 1.9263e-004 D1
# D2 -4.6480e-002 D2
# E 3.6000e-002 E
# Tau20 2.1100 Tau20
# H1 -3.3000e-002 H1
# H2 5.0000e+003 H2
# H3 1.4500e+003 H3
# CalibrationCoefficients
# OxygenSensor
# sensor
# sensor Channel="8"
# !-- A/D voltage 2, Fluorometer, Seapoint --
# FluoroSeapointSensor SensorID="11"
# SerialNumber SCF 3004 SerialNumber
# CalibrationDate CalibrationDate
# !-- The following is an array index, not the actual gain setting. --
# GainSetting 1 GainSetting
# Offset 0.000 Offset
# FluoroSeapointSensor
# sensor
# sensor Channel="9"
# !-- A/D voltage 3, PAR/Irradiance, Biospherical/Licor --
# PAR_BiosphericalLicorChelseaSensor SensorID="42"
# SerialNumber 4506 SerialNumber
# CalibrationDate 8/28/08 CalibrationDate
# M 1.00000000 M
# B 0.00000000 B
# CalibrationConstant 422000000000.00000000 CalibrationConstant
# Multiplier 1.00000000 Multiplier
# Offset -0.28658200 Offset
# PAR_BiosphericalLicorChelseaSensor
# sensor
# sensor Channel="10"
# !-- A/D voltage 4, Altimeter --
# AltimeterSensor SensorID="0"
# SerialNumber 1055 SerialNumber
# CalibrationDate 05/15/2003 CalibrationDate
# ScaleFactor 15.000 ScaleFactor
# Offset 0.000 Offset
# AltimeterSensor
# sensor
# sensor Channel="11"
# !-- A/D voltage 5, Free --
# sensor
# sensor Channel="12"
# !-- A/D voltage 6, User Polynomial --
# UserPolynomialSensor SensorID="61"
# SerialNumber UVP2 SerialNumber
# CalibrationDate CalibrationDate
# SensorName UVP SensorName
# A0 0.00000000 A0
# A1 1.00000000 A1
# A2 0.00000000 A2
# A3 0.00000000 A3
# UserPolynomialSensor
# sensor
# sensor Channel="13"
# !-- A/D voltage 7, Free --
# sensor
# sensor Channel="14"
# !-- SPAR voltage, Unavailable --
# sensor
# sensor Channel="15"
# !-- SPAR voltage, SPAR/Surface Irradiance --
# SPAR_Sensor SensorID="51"
# SerialNumber 6367 SerialNumber
# CalibrationDate 08/28/08 CalibrationDate
# ConversionFactor 0.00000000 ConversionFactor
# RatioMultiplier 0.00000000 RatioMultiplier
# SPAR_Sensor
# sensor
# Sensors
# datcnv_date = Jul 19 2010 08:22:18, 7.20b
# datcnv_in = C:CTDCheckley�35.hex C:CTDCheckley�35.CON
# datcnv_ox_hysteresis_correction = yes
# datcnv_ox_tau_correction = yes
# datcnv_bottle_scan_range_source = scans marked with bottle confirm bit, -4, 4
# datcnv_scans_per_bottle = 97
# bottlesum_date = Dec 12 2011 11:07:24, 7.20g
# bottlesum_in = C:Documents and SettingsjforrestbaldiniDesktopCheckleyprocessed�35.ros C:Documents and SettingsjforrestbaldiniDesktopNH1008-R1_v2_jfb.con
BCO-DMO Processing Notes
- Awk written to reformat original .btl files contributed by Jessica Forrest-Baldini
- AWK: NewHorizon_CTDbtl_2_BCODMO.awk
| File |
|---|
CTD_Bottle.csv (Comma Separated Values (.csv), 130.89 KB) MD5:01b20cad9d058989e0ab3e4bae0d08ff Primary data file for dataset ID 3715 |
| Parameter | Description | Units |
| CTD_Cast | CTD Cast Number/Id | Dimensionless |
| ISO_DateTime_UTC | CTD Date/Time from Header File (UTC) ISO formatted | YYYY-MM-DDTHH:MM:SS.xxZ |
| Date | CTD Date from Header File (UTC) | YYYYMMDD |
| Time | CTD Time from Header File (UTC) | HHMMSS |
| Latitude | CTD Latitude from Header File (South is negative) | decimal degrees |
| Longitude | CTD Longitude from Header File (West is negative) | decimal degrees |
| Depth | CTD Max depth | meters |
| Bottle_Position | Bottle Position | Dimensionless |
| ISO_DateTime_UTC_Bottle | Bottle Date/Time (UTC) ISO formatted | YYYY-MM-DDTHH:MM:SS.xxZ |
| Date_Bottle | Bottle Date (UTC) | YYYYMMDD |
| Time_Bottle | Bottle Time (UTC) | HHMMSS |
| Sigma_e00 | Density sigma-theta | Kg/m^3 |
| Sal00 | Salinity Practical | PSU |
| Sal11 | Salinity Practical 2 | PSU |
| PrDM_avg | Pressure Digiquartz Average | db |
| PrDM_sdev | Pressure Digiquartz SDev | db |
| PrDM_min | Pressure Digiquartz Minimum | db |
| PrDM_max | Pressure Digiquartz Maximum | db |
| T090C_avg | Temperature ITS-90 Average | deg C |
| T090C_sdev | Temperature ITS-90 Sdev | deg C |
| T090C_min | Temperature ITS-90 Minimum | deg C |
| T090C_max | Temperature ITS-90 Maximum | deg C |
| T190C_avg | Temperature 2 ITS-90 Average | deg C |
| T190C_sdev | Temperature 2 ITS-90 Sdev | deg C |
| T190C_min | Temperature 2 ITS-90 Minimum | deg C |
| T190C_max | Temperature 2 ITS-90 Maximum | deg C |
| C0mS_cm_avg | Conductivity Average | mS/cm |
| C0mS_cm_sdev | Conductivity Sdev | mS/cm |
| C0mS_cm_min | Conductivity Minimum | mS/cm |
| C0mS_cm_max | Conductivity Maximum | mS/cm |
| C1mS_cm_avg | Conductivity 2 Average | mS/cm |
| C1mS_cm_sdev | Conductivity 2 Sdev | mS/cm |
| C1mS_cm_min | Conductivity 2 Minimum | mS/cm |
| C1mS_cm_max | Conductivity 2 Maximum | mS/cm |
| Bat_avg | Beam Attenuation Chelsea/Seatech/WET Labs CStar Average | 1/m |
| Bat_sdev | Beam Attenuation Chelsea/Seatech/WET Labs CStar Sdev | 1/m |
| Bat_min | Beam Attenuation Chelsea/Seatech/WET Labs CStar Minimum | 1/m |
| Bat_max | Beam Attenuation Chelsea/Seatech/WET Labs CStar Maximum | 1/m |
| Sbeox0ML_L_avg | Oxygen SBE 43 Average | ml/l |
| Sbeox0ML_L_sdev | Oxygen SBE 43 Sdev | ml/l |
| Sbeox0ML_L_min | Oxygen SBE 43 Minimum | ml/l |
| Sbeox0ML_L_max | Oxygen SBE 43 Maximum | ml/l |
| FlSP_avg | Fluorescence Seapoint Average | nd |
| FlSP_sdev | Fluorescence Seapoint Sdev | nd |
| FlSP_min | Fluorescence Seapoint Minimum | nd |
| FlSP_max | Fluorescence Seapoint Maximum | nd |
| Par_avg | PAR/Irradiance Biospherical/Licor Average | nd |
| Par_sdev | PAR/Irradiance Biospherical/Licor Sdev | nd |
| Par_min | PAR/Irradiance Biospherical/Licor Minimum | nd |
| Par_max | PAR/Irradiance Biospherical/Licor Maximum | nd |
| Spar_avg | SPAR/Surface Irradiance Average | nd |
| Spar_sdev | SPAR/Surface Irradiance Sdev | nd |
| Spar_min | SPAR/Surface Irradiance Minimum | nd |
| Spar_max | SPAR/Surface Irradiance Maximum | nd |
| Upoly0_avg | Upoly 0 UVP Average | Nephelometric Turbidity Units (NTU) |
| Upoly0_sdev | Upoly 0 UVP Sdev | Nephelometric Turbidity Units (NTU) |
| Upoly0_min | Upoly 0 UVP Minimum | Nephelometric Turbidity Units (NTU) |
| Upoly0_max | Upoly 0 UVP Maximum | Nephelometric Turbidity Units (NTU) |
| AltM_avg | Altimeter Average | meters |
| AltM_sdev | Altimeter Sdev | meters |
| AltM_min | Altimeter Minimum | meters |
| AltM_max | Altimeter Maximum | meters |
| Dataset-specific Instrument Name | CTD Sea-Bird SBE 911plus |
| Generic Instrument Name | CTD Sea-Bird SBE 911plus |
| Dataset-specific Description | * Sea-Bird SBE 9 Data File:
* FileName = C:CTDCheckley |
| Generic Instrument Description | The Sea-Bird SBE 911 plus is a type of CTD instrument package for continuous measurement of conductivity, temperature and pressure. The SBE 911 plus includes the SBE 9plus Underwater Unit and the SBE 11plus Deck Unit (for real-time readout using conductive wire) for deployment from a vessel. The combination of the SBE 9 plus and SBE 11 plus is called a SBE 911 plus. The SBE 9 plus uses Sea-Bird's standard modular temperature and conductivity sensors (SBE 3 plus and SBE 4). The SBE 9 plus CTD can be configured with up to eight auxiliary sensors to measure other parameters including dissolved oxygen, pH, turbidity, fluorescence, light (PAR), light transmission, etc.). more information from Sea-Bird Electronics |
| Dataset-specific Instrument Name | Niskin bottle |
| Generic Instrument Name | Niskin bottle |
| Generic Instrument Description | A Niskin bottle (a next generation water sampler based on the Nansen bottle) is a cylindrical, non-metallic water collection device with stoppers at both ends. The bottles can be attached individually on a hydrowire or deployed in 12, 24, or 36 bottle Rosette systems mounted on a frame and combined with a CTD. Niskin bottles are used to collect discrete water samples for a range of measurements including pigments, nutrients, plankton, etc. |
NH1008
| Website | |
| Platform | R/V New Horizon |
| Report | |
| Start Date | 2010-07-08 |
| End Date | 2010-07-25 |
| Description | Collaborative Research: Zooplankton at the Base of the Particle Maximum: Gatekeepers of the Vertical Flux?: Deployment and recovery of SOLOPCs in Monterey Bay, plus CTD and MOCNESS deployments in Monterey Bay
Cruise information and original data are available from the NSF R2R data catalog.
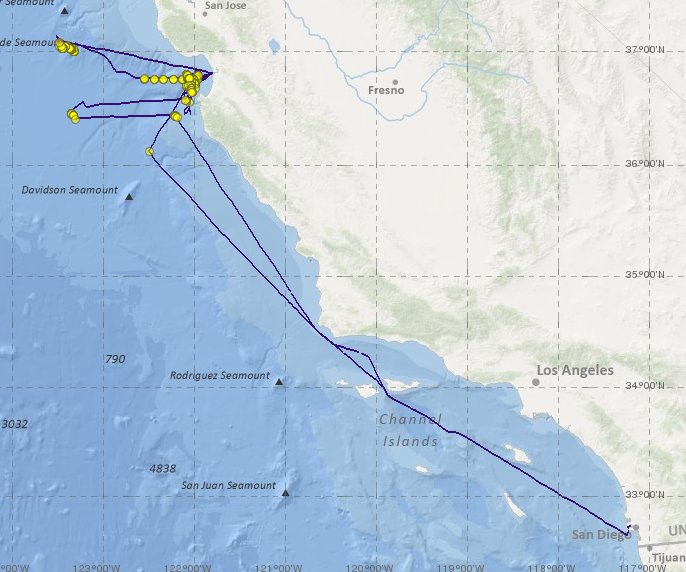
Figure 1. R/V New Horizon Cruise NH1008 GATEKEEPERS
[click on the image to view a larger version] |
Zooplankton feeding at the base of the particle maximum: Gatekeepers of the Vertical Flux? (GATEKEEPERS)
Zooplankton feeding at the base of the particle maximum: Gatekeepers of the Vertical Flux?
A range of observations suggest that zooplankton act as gatekeepers for material leaving the euphotic zone. This study will investigate the interactions of zooplankton with other particles using a suite of autonomous and tethered instruments in conjunction with finescale water sampling. The SOLOPC (Sounding Oceanographic Observer with Laser Optical Plankton Counter) will be the autonomous instrument and provide hourly profiles of zooplankton and other particles. Previous sampling with the SOLOPC indicated a diel cycle of production and abundance of particles in the euphotic zone and their sinking and consumption, presumably by zooplankton observed at the base of the particle abundance maximum. The SOLOPC senses particles, including zooplankton and aggregates, and measures their equivalent spherical diameters which can be used to compute particle size spectra. However, it is difficult to use the SOLOPC to distinguish among particle types, such as copepods, larvaceans, and aggregates, particularly if they are small. The research will include an intensive field study that will take place in Monterey Bay and use adaptive sampling to observe near SOLOPCs with a new, AUV-borne imaging system, ship-based CTD and MOCNESS sampling, and MBARI's ROV Ventana. The investigators will alter a SOLOPC to be stationary relative to an isopycnal and use the particle counts that it accumulates to calculate a flux spectrum. They will combine the flux and concentration spectra to estimate particle sinking velocities as a function of particle diameter. Zooplankton feeding in the water column will be estimated by analyzing the gut fluorescence of animals caught in zooplankton nets and by counting the distribution of fecal pellets in water samples. Results will enhance the understanding of the role of the zooplankton as gatekeepers in the vertical flux of particles and, hence, the biological pump. The study will also provide new insight into factors that affect zooplankton behavior and ecology.
Collaborating institutions include SIO, TAMU, LUMCON, MBARI, BIO, and Université Paris VI. The SOLOPC, modified to measure flux as well as profile, and REFLICS are intended for acquisition and use by other researchers worldwide. The understanding we gain of role of the zooplankton as gatekeepers of the vertical flux will contribute valuably to understanding of the biological pump and the carbon cycle.
PUBLICATIONS PRODUCED AS A RESULT OF THIS RESEARCH
Jackson, GA and DM Checkley Jr. "Particle size distributions in the upper 100 m water column and their implications for animal feeding in the plankton," Deep-Sea Research, 2011.
Figure 1. R/V New Horizon Cruise NH1008 GATEKEEPERS
[click on the image to view a larger version]
| Funding Source | Award |
|---|---|
| NSF Division of Ocean Sciences (NSF OCE) | |
| NSF Division of Ocean Sciences (NSF OCE) | |
| NSF Division of Ocean Sciences (NSF OCE) |
[ table of contents | back to top ]