Concentrations of dissolved iron and dissolved iron(II) from R/V Knorr cruises KN199-04 and KN204-01 in the Subtropical northern Atlantic Ocean from 2010-2011 (U.S. GEOTRACES NAT project)
Project
Program
| Contributors | Affiliation | Role |
|---|---|---|
| Sedwick, Peter N. | Old Dominion University (ODU) | Principal Investigator |
| Bowie, Andrew R. | Antarctic Climate and Ecosystems Cooperative Research Centre (ACE CRC) | Co-Principal Investigator |
| Copley, Nancy | Woods Hole Oceanographic Institution (WHOI BCO-DMO) | BCO-DMO Data Manager |
| Rauch, Shannon | Woods Hole Oceanographic Institution (WHOI BCO-DMO) | BCO-DMO Data Manager |
Abstract
Concentrations of dissolved iron and dissolved iron(II) in water-column samples from major stations occupied during first and second legs of the U.S. GEOTRACES North Atlantic zonal transect cruises.
Sample collection and processing:
Water-column samples for trace metal analysis were collected in modified 12 L Teflon-lined GO-FLO samplers (General Oceanics Inc.), deployed on the U.S. GEOTRACES clean CTD rosette system with a total of 24 samplers. All samples were filtered as soon as possible after recovery by GEOTRACES sampling personnel using 0.2 µm Supor Acropak filter cartridge (Pall Corp.) inside the U.S. GEOTRACES clean-air laboratory van. Near-surface samples (from ~2 m depth) were collected while underway on approach to each station using the Bruland-Smith trace-metal towfish, which was towed outside of the ship’s wake. Seawater from the towfish was pumped directly into a clean-air laboratory van, where it was filtered through 0.2 µm Supor Acropak filter cartridges.
Dissolved iron (dFe) analysis:
The filtered seawater samples were collected in 125 mL acid-cleaned Nalgene wide-mouth low-density polyethylene bottles, acidified to pH ~1.7 with Fisher Optima grade ultrapure hydrochloric acid, and then stored at room temperature until post-cruise analysis at Old Dominion University by Bettina Sohst. Dissolved iron was determined by flow injection analysis with colorimetric detection after in-line preconcentration on resin-immobilized 8-hydroxyquinoline [Sedwick et al., 2005, 2008], using a method modified from Measures et al. [1995]. The efficacy of our analytical method for dFe was verified through the analysis of the SAFe seawater reference materials. Over the period during which these samples were analyzed (2010-2012), we determined mean dFe values of 0.122 ± 0.021 nM (n = 7) for SAFe seawater reference material S and 1.13 ± 0.19 nM (n = 2) for SAFe seawater reference material D2, versus community consensus values of 0.095 ± 0.008 nM and 0.955 ± 0.024 nM, respectively (as of May 2013). The analytical limit of detection is estimated as the dFe concentration equivalent to a peak area that is three times the standard deviation on the "zero-loading blank" (or "manifold blank"), from which we estimate a detection limit of less than 0.04 nM [Bowie et al., 2004; Sedwick et al., 2005]. Blank contributions from the ammonium acetate sample buffer solution (added on-line during analysis) and hydrochloric acid (added after collection) are typically negligible (i.e., too low to quantify). Robust estimates of our analytical precision are derived from multiple (separate-day) determinations of the SAFe seawater reference materials, which yield analytical uncertainties (expressed as ± one relative sample standard deviation on the mean) of ±14.7% (n = 33) at the concentration level of SAFe S seawater (0.095 nM), and ±9.2% (n = 16) at the concentration level of SAFe D2 seawater (0.955 nM).
Dissolved iron(II) (dFe(II)) analysis:
The filtered seawater samples were transported from the sampling station to a shipboard clean-air laboratory van in a cooler, and were analyzed at sea by Bettina Sohst as soon as possible after sampling. Dissolved iron(II) was determined by flow injection analysis with in-line preconcentration modified after the method of Bowie et al. [2005]. The analytical limit of detection was estimated daily as the dFe(II) concentration corresponding to a signal three times the standard deviation on triplicate analyses of the blank [Bowie et al., 2004; Sarthou et al., 2011]. For the blank solution, we used filtered, aged, low-iron seawater that was stored in the dark ("low Fe(II) seawater"), for which the chemiluminescence signal was analytically indistinguishable from reagents injected without seawater [see Bowie et al., 2005]. KN199-04: The limit of detection averaged <0.06 nM for all of the daily shipboard analyses (n = 16). KN204-01: The limit of detection averaged <0.01 nM for all of the daily shipboard analyses (n = 31).
There is no standard reference material for the determination of dissolved iron(II) in seawater, thus we are unable to provide rigorous estimates of the accuracy and precision of the dFe(II) determinations. However, some indication of our analytical uncertainty is provided by repeat measurements of standards prepared in low-Fe(II) seawater, which yielded average relative standard deviations of <17% (KN199-04) or <13% (KN204-01) and <11% for triplicate injections of 0.2 nM and 0.4 nM dFe(II) standards, respectively.
References:
Bowie, A. R., P. N. Sedwick, and P. J. Worsfold (2004), Analytical intercomparison between flow injection-chemiluminescence and flow injection-spectrophotometry for the determination of picomolar concentrations of iron in seawater, Limnology & Oceanography Methods, 2, 42-54. doi: 10.4319/lom.2004.2.42.
Bowie, A. R., E. P. Achterberg, S. Ussher, and P. J. Worsfold (2005), Design of an automated flow injection-chemiluminescense instrument incorporating a miniature photomultiplier tube for monitoring picomolar concentrations of iron in seawater, Journal of Automated Methods & Management in Chemistry, 2, 37-43. doi: 10.1155/JAMMC.2005.37.
Measures, C. I., J. Yuan, and J. A. Resing (1995), Determination of iron in seawater by flow injection analysis using in-line preconcentration and spectrophotometric detection, Marine Chemistry, 50, 3-12. doi: 10.1016/0304-4203(95)00022-J.
Sarthou, G., E. Bucciarelli, F. Chever, S. P. Hansard, M. González-Dávila, J. M. Santana-Casiano, F. Planchon, and S. Speich (2011), Labile Fe(II) concentrations in the Atlantic sector of the Southern Ocean along a transect from the subtropical domain to the Weddell Sea Gyre, Biogeosciences, 8, 2461-2479, doi: 10.5194/bg-8-2461-2011.
Sedwick, P. N., T. M. Church, A. R. Bowie, C. M. Marsay, S. J. Ussher, K. M. Achilles, P. J. Lethaby, R. J. Johnson, M. M. Sarin, and D. J. McGillicuddy (2005), Iron in the Sargasso Sea (Bermuda Atlantic Time-series Study region) during summer: Eolian imprint, spatiotemporal variability, and ecological implications, Global Biogeochemical Cycles, 19, GB4006, doi: 10.1029/2004GB002445.
Sedwick, P. N., A. R. Bowie, and T. W. Trull (2008), Dissolved iron in the Australian sector of the Southern Ocean (CLIVAR-SR3 section): meridional and seasonal trends, Deep-Sea Research I, 55, 911-925, doi: 10.1016/j.dsr.2008.03.011.
Data processing:
Following subtraction of appropriate blank values, sample concentrations were calculated using least-square linear regressions fit to daily calibration curves that were obtained by additions of iron and iron(II) standard solutions to low-iron seawater.
Note on concentration units: All analyses were performed on a volumetric basis, so all concentrations are reported in units of nanomole liter-1 (nM). To convert to units of nmol kg-1, divide the nM concentrations by 1.024 kg l-1 (the approximate density of seawater at a laboratory temperature of 20 degrees C).
BCO-DMO Processing Notes:
Converted original lon values in decimal degrees west to negative values (decimal degrees east); added column for official cruise_id and for cruise_part; converted original date from dd/mm/yyyy format to date in yyyymmdd format; added 'nd' to indicate 'no data' for depths not sampled; changed parameter names; added basic GEOTRACES metadata (see below).
Additional GEOTRACES Processing:
After the data were submitted to the International Data Management Office, BODC, the office noticed that important identifying information was missing in many datasets. With the agreement of BODC and the US GEOTRACES lead PIs, BCO-DMO added standard US GEOTRACES information, such as the US GEOTRACES event number, to each submitted dataset lacking this information. To accomplish this, BCO-DMO compiled a 'master' dataset composed of the following parameters: station_GEOTRC, cast_GEOTRC (bottle and pump data only), event_GEOTRC, sample_GEOTRC, sample_bottle_GEOTRC (bottle data only), bottle_GEOTRC (bottle data only), depth_GEOTRC_CTD (bottle data only), depth_GEOTRC_CTD_rounded (bottle data only), BTL_ISO_DateTime_UTC (bottle data only), and GeoFish_id (GeoFish data only). This added information will facilitate subsequent analysis and inter comparison of the datasets.
Bottle parameters in the master file were taken from the GT-C_Bottle_GT10, GT-C_Bottle_GT11, ODF_Bottle_GT10, and ODF_Bottle_GT11 datasets. Non-bottle parameters, including those from GeoFish tows, Aerosol sampling, and McLane Pumps, were taken from the Event_Log_GT10 and Event_Log_GT11 datasets. McLane pump cast numbers missing in event logs were taken from the Particulate Th-234 dataset submitted by Ken Buesseler.
A standardized BCO-DMO method (called "join") was then used to merge the missing parameters to each US GEOTRACES dataset, most often by matching on sample_GEOTRC or on some unique combination of other parameters.
If the master parameters were included in the original data file and the values did not differ from the master file, the original data columns were retained and the names of the parameters were changed from the PI-submitted names to the standardized master names. If there were differences between the PI-supplied parameter values and those in the master file, both columns were retained. If the original data submission included all of the master parameters, no additional columns were added, but parameter names were modified to match the naming conventions of the master file.
See the dataset parameters documentation for a description of which parameters were supplied by the PI and which were added via the join method.
| File |
|---|
Fe_dissolved_joined.csv (Comma Separated Values (.csv), 92.78 KB) MD5:021030400ad51498673d5f1a8e1ad640 Primary data file for dataset ID 3826 |
| Parameter | Description | Units |
| cruise_id | Official cruise identifier e.g. KN199-04 = R/V Knorr cruise number 199-04. | text |
| station_GEOTRC | GEOTRACES station number; ranges from 1 through 12 for KN199-04 and 1 through 24 for KN204-01. Stations 7 and 9 were skipped on KN204-01. Some GeoFish stations are denoted as X_to_Y indicating the tow occurred between stations X and Y. Values were added from the intermediate US GEOTRACES master file (see Processing Description). | integer |
| cruise_part | Part of cruise. For KN204-01: A = 11/6/2011 to 11/18/2011 (Woods Hole to Bermuda); B = 11/19/2011 to 12/11/2011 (Bermuda to Praia Cabo Verde) | alphanumeric |
| cruise_name | Name chosen by project investigators for the research expedition as opposed to the formal/official cruise ID asserted by the vessel operator. | text |
| lat_sta | Station latitude; north is positive. | decimal degrees |
| lon_sta | Station longitude; east is positive. | decimal degrees |
| depth_GEOTRC_CTD | Observation/sample depth in meters; calculated from CTD pressure. Values were added from the intermediate US GEOTRACES master file (see Processing Description). | meters |
| event_GEOTRC | Unique identifying number for US GEOTRACES sampling events; ranges from 2001 to 2225 for KN199-04 events and from 3001 to 3282 for KN204-01 events. Values were added from the intermediate US GEOTRACES master file (see Processing Description). | integer |
| cast_GEOTRC | Cast identifier numbered consecutively within a station. Values were added from the intermediate US GEOTRACES master file (see Processing Description). | integer |
| sample_GEOTRC | Unique identifying number for US GEOTRACES samples; ranges from 5033 to 6078 for KN199-04 and from 6112 to 8148 for KN204-01. PI-supplied values were identical to those in the intermediate US GEOTRACES master file. Originally submitted as 'Sample ID', this parameter name has been changed to conform to BCO-DMO's GEOTRACES naming conventions. | integer |
| sample_bottle_GEOTRC | Unique identification numbers given to samples taken from bottles; ranges from 1 to 24; often used synonymously with bottle number. Values were added from the intermediate US GEOTRACES master file (see Processing Description). | dimensionless |
| bottle_GEOTRC | Alphanumeric characters identifying bottle type (e.g. NIS representing Niskin and GF representing GOFLO) and position on a CTD rosette. Values were added from the intermediate US GEOTRACES master file (see Processing Description). | dimensionless |
| lat_cast | Latitude when sampling cast was started; north is positive (nd = underway sample collected on approach to station using towfish; exact coordinates not available). | decimal degrees |
| lon_cast | Longitude when sampling cast was started; west is negative (nd = underway sample collected on approach to station using towfish; exact coordinates not available). | decimal degrees |
| year | year when cast was started | YYYY |
| month | month when cast was started (UTC). | 1 to 12 |
| day | day when cast was started (UTC). | 1 to 31 |
| yrday_gmt | year-day when cast was started (UTC). | 1 to 365 |
| dFe | dissolved iron concentration | nanomoles/liter (nM) |
| dFe_corr | Corrected dissolved iron concentration based on difference between mean values determined for SAFe reference seawater materials S and D2 and community consensus values (details are presented under the heading 'Dissolved iron analysis' under 'Acquisition Description'). The linear-fit correction is: dFe-corr = 0.853dFe - 0.009 nM | nanomoles/liter (nM) |
| sigma_dFe_corr | "Estimated analytical uncertainty (1 standard deviation) on dFe-corr as estimated from the percent relative standard deviation (RSD) on the mean of repeat determinations of the SAFe seawater reference materials S and D2 (details are presented under the heading 'Dissolved iron analysis' under 'Acquisition Description'). A linear fit of %RSD versus reference seawater concentration is used to estimate RSD values for dFe-corr values of less than or equal to 0.96 nM [equation: %RSD = 15.5 - 6.66(dFe-corr)] whereas a constant RSD of 9.2% is applied to dFe-corr values > 0.96 nM. | nanomoles/liter (nM) |
| dFe_flag | Dissolved iron data quality flag: 2=good; 9=missing data | integer |
| dFe_II | dissolved iron(II) concentration | nanomoles/liter (nM) |
| dFe_II_flag | Dissolved iron(II) data quality flag: 2=good; 3=questionable: below limit of detection; 9=missing data | integer |
| comments | Comments pertaining to the data. | text |
| BTL_ISO_DateTime_UTC | Date and time (UTC) variable recorded at the bottle sampling time in ISO compliant format. Values were added from the intermediate US GEOTRACES master file (see Processing Description). This standard is based on ISO 8601:2004(E) and takes on the following form: 2009-08-30T14:05:00[.xx]Z (UTC time) | YYYY-MM-DDTHH:MM:SS[.xx][+/-TZ] |
| date | Sample collection date (UTC). | YYYYmmdd |
| Dataset-specific Instrument Name | GeoFish |
| Generic Instrument Name | GeoFish Towed near-Surface Sampler |
| Generic Instrument Description | The GeoFish towed sampler is a custom designed near surface (2 meters or less) sampling system for the collection of trace metal clean seawater. It consists of a PVC encapsulated lead weighted torpedo and separate PVC depressor vane supporting the intake utilizing all PFA Teflon tubing connected to a deck mounted, air-driven, PFA Teflon dual-diaphragm pump which provides trace-metal clean seawater at up to 3.7L/min. The GeoFish is towed at up to 13kts off to the side of the vessel outside of the ship's wake to avoid possible contamination from the ship's hull. It was developed by Geoffrey Smith and Ken Bruland (University of California, Santa Cruz). |
| Dataset-specific Instrument Name | GO-FLO Teflon Trace Metal |
| Generic Instrument Name | GO-FLO Teflon Trace Metal Bottle |
| Generic Instrument Description | GO-FLO Teflon-lined Trace Metal free sampling bottles are used for collecting water samples for trace metal, nutrient and pigment analysis. The GO-FLO sampling bottle is designed specifically to avoid sample contamination at the surface, internal spring contamination, loss of sample on deck (internal seals), and exchange of water from different depths. |
KN199-04
| Website | |
| Platform | R/V Knorr |
| Report | |
| Start Date | 2010-10-15 |
| End Date | 2010-11-04 |
| Description | This cruise constitutes the first survey section as part of the U.S. participation in an international program named GEOTRACES.
Funding: NSF OCE award 0926423
Science Objectives: To obtain state of the art trace metal and isotope measurements on a suite of samples taken on a mid-latitude zonal transect of the North Atlantic. In particular, sampling targeted the oxygen minimum zone extending off the west African coast near Mauritania, the TAG hydrothermal field, and the western boundary current system along Line W. For additional information, please refer to the GEOTRACES program Web site (https://www.geotraces.org/) for overall program objectives and a summary of properties measured.
Science Activities include seawater sampling via GoFLO and Niskin carousels, in situ pumping (and filtration), CTDO2 and transmissometer sensors, underway pumped sampling of surface waters, and collection of aerosols and rain. Hydrography, CTD and nutrient measurements were supported by the Ocean Data Facility (J. Swift) at Scripps Institution of Oceanography and funded through NSF Facilities. They provided an additional CTD rosette system along with nephelometer and LADCP. A trace metal clean Go-Flo Rosette and winch were provided by the group at Old Dominion University (G. Cutter) along with a towed underway pumping system.
Additional cruise information is available from the Rolling Deck to Repository (R2R): https://www.rvdata.us/search/cruise/KN199-04
Other Relevant Links:
List of cruise participants: [ PDF ]
Cruise track: JPEG image (from Woods Hole Oceanographic Institution, vessel operator)
ADCP data are available from the Currents ADCP group at the University of Hawaii: KN199-04 ADCP |
KN204-01
| Website | |
| Platform | R/V Knorr |
| Report | |
| Start Date | 2011-11-06 |
| End Date | 2011-12-11 |
| Description | The US GEOTRACES North Atlantic cruise aboard the R/V Knorr completed the section between Lisbon and Woods Hole that began in October 2010 but was rescheduled for November-December 2011. The R/V Knorr made a brief stop in Bermuda to exchange samples and personnel before continuing across the basin. Scientists disembarked in Praia, Cape Verde, on 11 December. The cruise was identified as KN204-01A (first part before Bermuda) and KN204-01B (after the Bermuda stop). However, the official deployment name for this cruise is KN204-01 and includes both part A and B.
Science activities included: ODF 30 liter rosette CTD casts, ODU Trace metal rosette CTD casts, McLane particulate pump casts, underway sampling with towed fish and sampling from the shipboard "uncontaminated" flow-through system.
Full depth stations are shown in the accompanying figure (see below). Additional stations to sample for selected trace metals to a depth of 1000 m are not shown. Standard stations are shown in red (as are the ports) and "super" stations, with extra casts to provide large-volume samples for selected parameters, are shown in green.
Station spacing is concentrated along the western margin to evaluate the transport of trace elements and isotopes by western boundary currents. Stations across the gyre will allow scientists to examine trace element supply by Saharan dust, while also contrasting trace element and isotope distributions in the oligotrophic gyre with conditions near biologically productive ocean margins, both in the west, to be sampled now, and within the eastern boundary upwelling system off Mauritania, sampled last year.
Funding: The cruise was funded by NSF OCE awards 0926204, 0926433 and 0926659.
Additional cruise information is available from the Rolling Deck to Repository (R2R): https://www.rvdata.us/search/cruise/KN204-01
Other Relevant Links:
ADCP data are available from the Currents ADCP group at the University of Hawaii at the links below:
KN204-01A (part 1 of 2011 cruise; Woods Hole, MA to Bermuda)
KN204-01B (part 2 of 2011 cruise; Bermuda to Cape Verde) |
U.S. GEOTRACES North Atlantic Transect (GA03) (U.S. GEOTRACES NAT)
Much of this text appeared in an article published in OCB News, October 2008, by the OCB Project Office.
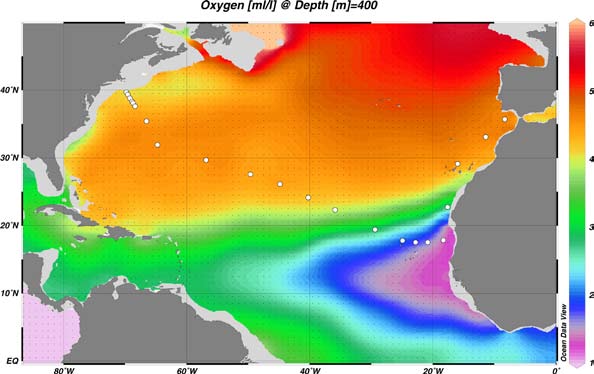
The first U.S. GEOTRACES Atlantic Section will be specifically centered around a sampling cruise to be carried out in the North Atlantic in 2010. Ed Boyle (MIT) and Bill Jenkins (WHOI) organized a three-day planning workshop that was held September 22-24, 2008 at the Woods Hole Oceanographic Institution. The main goal of the workshop, sponsored by the National Science Foundation and the U.S. GEOTRACES Scientific Steering Committee, was to design the implementation plan for the first U.S. GEOTRACES Atlantic Section. The primary cruise design motivation was to improve knowledge of the sources, sinks and internal cycling of Trace Elements and their Isotopes (TEIs) by studying their distributions along a section in the North Atlantic (Figure 1). The North Atlantic has the full suite of processes that affect TEIs, including strong meridional advection, boundary scavenging and source effects, aeolian deposition, and the salty Mediterranean Outflow. The North Atlantic is particularly important as it lies at the "origin" of the global Meridional Overturning Circulation.
It is well understood that many trace metals play important roles in biogeochemical processes and the carbon cycle, yet very little is known about their large-scale distributions and the regional scale processes that affect them. Recent advances in sampling and analytical techniques, along with advances in our understanding of their roles in enzymatic and catalytic processes in the open ocean provide a natural opportunity to make substantial advances in our understanding of these important elements. Moreover, we are motivated by the prospect of global change and the need to understand the present and future workings of the ocean's biogeochemistry. The GEOTRACES strategy is to measure a broad suite of TEIs to constrain the critical biogeochemical processes that influence their distributions. In addition to these "exotic" substances, more traditional properties, including macronutrients (at micromolar and nanomolar levels), CTD, bio-optical parameters, and carbon system characteristics will be measured. The cruise starts at Line W, a repeat hydrographic section southeast of Cape Cod, extends to Bermuda and subsequently through the North Atlantic oligotrophic subtropical gyre, then transects into the African coast in the northern limb of the coastal upwelling region. From there, the cruise goes northward into the Mediterranean outflow. The station locations shown on the map are for the "fulldepth TEI" stations, and constitute approximately half of the stations to be ultimately occupied.
Figure 1. The proposed 2010 Atlantic GEOTRACES cruise track plotted on dissolved oxygen at 400 m depth. Data from the World Ocean Atlas (Levitus et al., 2005) were plotted using Ocean Data View (courtesy Reiner Schlitzer). [click on the image to view a larger version]
Hydrography, CTD and nutrient measurements will be supported by the Ocean Data Facility (J. Swift) at Scripps Institution of Oceanography and funded through NSF Facilities. They will be providing an additional CTD rosette system along with nephelometer and LADCP. A trace metal clean Go-Flo Rosette and winch will be provided by the group at Old Dominion University (G. Cutter) along with a towed underway pumping system.
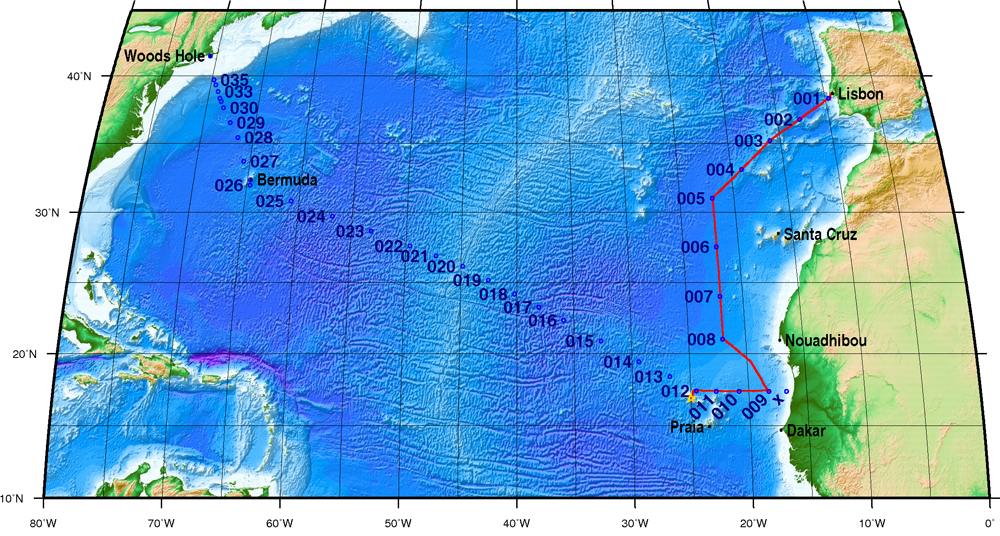
The North Atlantic Transect cruise began in 2010 with KN199 leg 4 (station sampling) and leg 5 (underway sampling only) (Figure 2).
Figure 2. The red line shows the cruise track for the first leg of the US Geotraces North Atlantic Transect on the R/V Knorr in October 2010. The rest of the stations (beginning with 13) will be completed in October-December 2011 on the R/V Knorr (courtesy of Bill Jenkins, Chief Scientist, GNAT first leg). [click on the image to view a larger version]
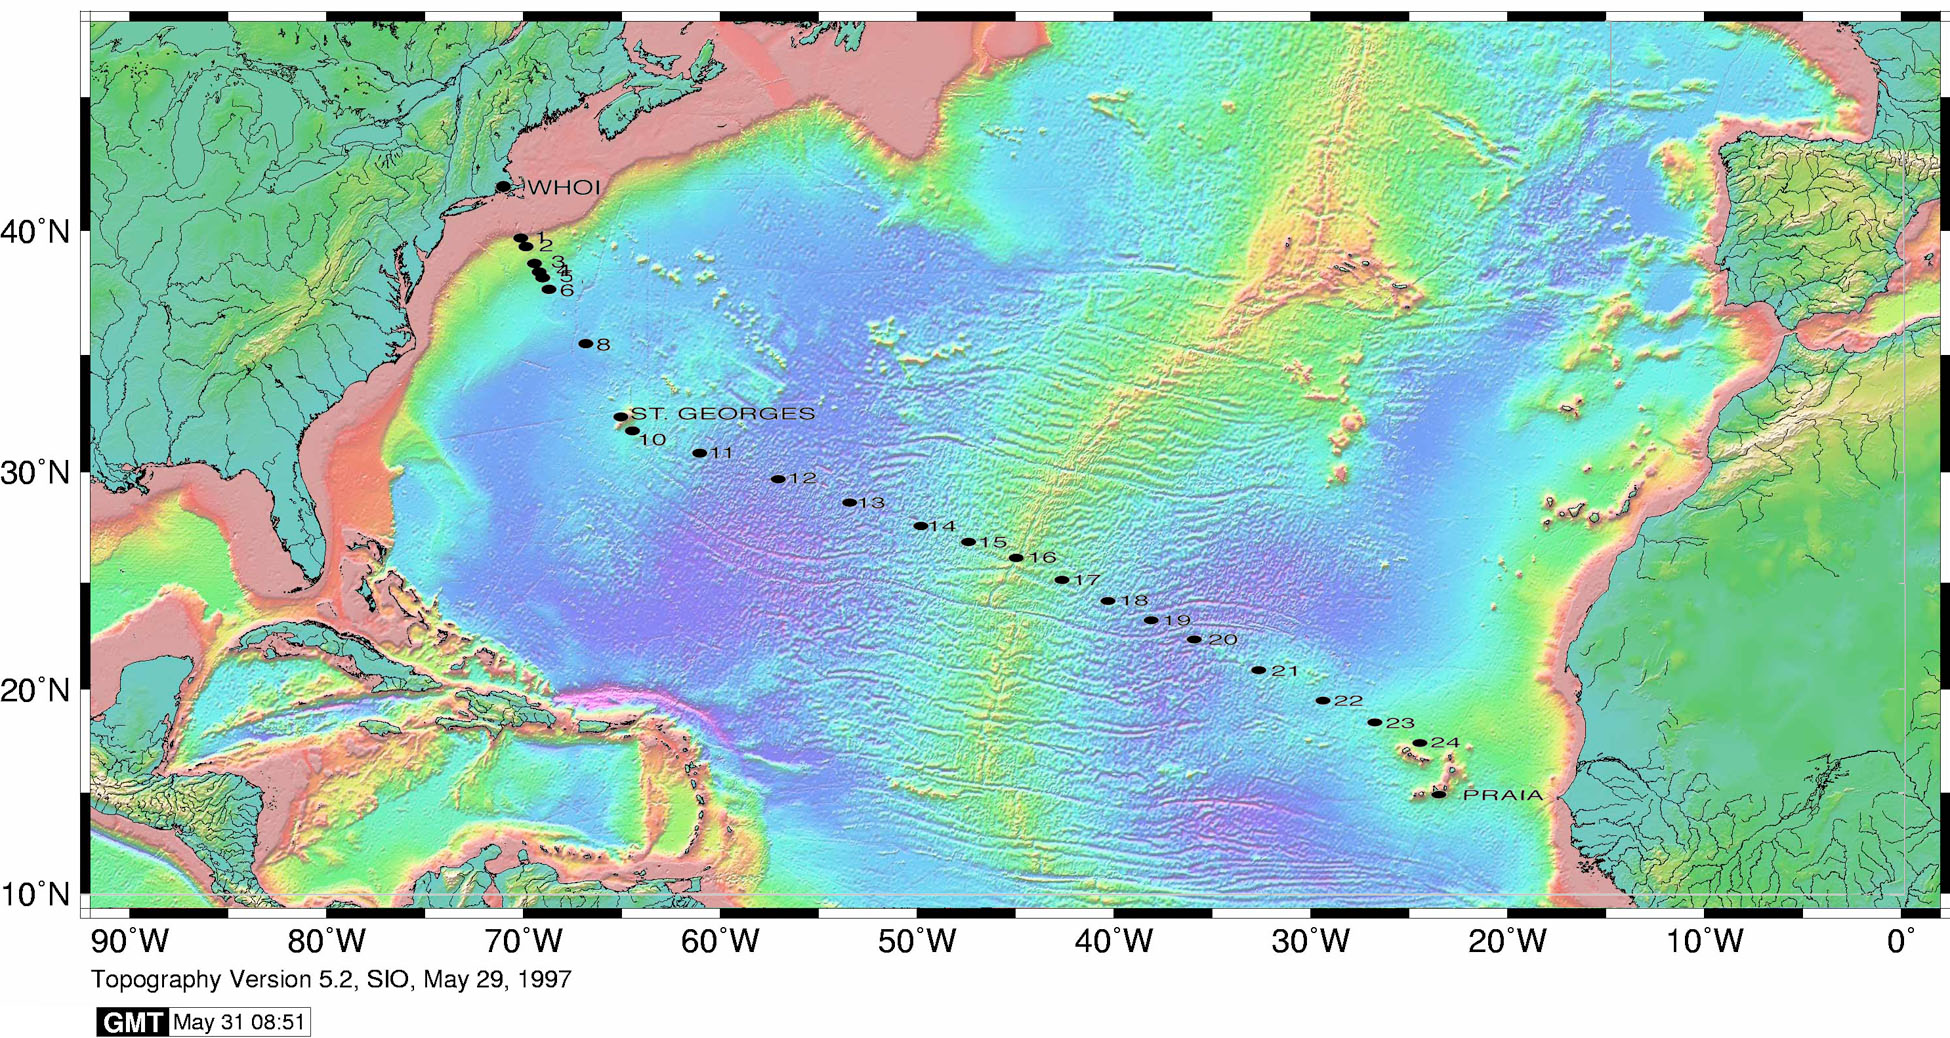
The section completion effort resumed again in November 2011 with KN204-01A,B (Figure 3).
KN204-01A,B Cruise Report (PDF)
Figure 3. Station locations occupied on the US Geotraces North Atlantic Transect on the R/V Knorr in November 2011. [click on the image to view a larger version]
Data from the North Atlantic Transect cruises are available under the Datasets heading below, and consensus values for the SAFe and North Atlantic GEOTRACES Reference Seawater Samples are available from the GEOTRACES Program Office: Standards and Reference Materials
ADCP data are available from the Currents ADCP group at the University of Hawaii at the links below:
KN199-04 (leg 1 of 2010 cruise; Lisbon to Cape Verde)
KN199-05 (leg 2 of 2010 cruise; Cape Verde to Charleston, NC)
KN204-01A (part 1 of 2011 cruise; Woods Hole, MA to Bermuda)
KN204-01B (part 2 of 2011 cruise; Bermuda to Cape Verde)
U.S. GEOTRACES (U.S. GEOTRACES)
GEOTRACES is a SCOR sponsored program; and funding for program infrastructure development is provided by the U.S. National Science Foundation.
GEOTRACES gained momentum following a special symposium, S02: Biogeochemical cycling of trace elements and isotopes in the ocean and applications to constrain contemporary marine processes (GEOSECS II), at a 2003 Goldschmidt meeting convened in Japan. The GEOSECS II acronym referred to the Geochemical Ocean Section Studies To determine full water column distributions of selected trace elements and isotopes, including their concentration, chemical speciation, and physical form, along a sufficient number of sections in each ocean basin to establish the principal relationships between these distributions and with more traditional hydrographic parameters;
* To evaluate the sources, sinks, and internal cycling of these species and thereby characterize more completely the physical, chemical and biological processes regulating their distributions, and the sensitivity of these processes to global change; and
* To understand the processes that control the concentrations of geochemical species used for proxies of the past environment, both in the water column and in the substrates that reflect the water column.
GEOTRACES will be global in scope, consisting of ocean sections complemented by regional process studies. Sections and process studies will combine fieldwork, laboratory experiments and modelling. Beyond realizing the scientific objectives identified above, a natural outcome of this work will be to build a community of marine scientists who understand the processes regulating trace element cycles sufficiently well to exploit this knowledge reliably in future interdisciplinary studies.
Expand "Projects" below for information about and data resulting from individual US GEOTRACES research projects.
| Funding Source | Award |
|---|---|
| NSF Division of Ocean Sciences (NSF OCE) |
[ table of contents | back to top ]