Trace metal and major anion concentrations in unfiltered rainwater from R/V Knorr cruises KN199-04 and KN204-01 (GA03) in the Subtropical northern Atlantic Ocean from 2010-2011 (U.S. GEOTRACES NAT project)
Project
Program
| Contributors | Affiliation | Role |
|---|---|---|
| Landing, William M. | Florida State University (FSU - EOAS) | Principal Investigator |
| Shelley, Rachel | Florida State University (FSU - EOAS) | Contact |
| Rauch, Shannon | Woods Hole Oceanographic Institution (WHOI BCO-DMO) | BCO-DMO Data Manager |
Abstract
Trace metals (Li, Na, Mg, Al, P, Ti, V, Cr, Mn, Fe, Co, Ni, Cu, Zn, Ga, As, Se, Rb, Sr, Zr, Cd, Sn, Sb, Cs, Ba, La, Nd, Pb, Th, U) and major seawater anions (Cl, NO3, SO4) in unfiltered rainwater from the 2010 and 2011 U.S. GEOTRACES North Atlantic Transect cruises.
Rain samples were collected in acid-washed 1 L LDPE bottles fitted with a funnel (diameter 27.94 square centimeters) positioned in a 25 L bucket deployed on an N-CON precipitation sampler (model 00-120-2) attached to the forward railings of the ship’s flying bridge (14 m above sea level) as high off the water as possible to minimize contamination. As soon as a rain event had ended the samples were collected. Approximately half the sample was filtered (0.45 µm GN-6 Metricel filters; cellulose esters) using a polysulfone vacuum filter assembly (Nalgene); the other half remained unfiltered. Both filtered and unfiltered samples were acidified to 0.024 M with ultra-high purity HCl, decanted into polypropylene bottles and double-bagged for storage. Before acidification, an aliquot was taken from the unfiltered sample and frozen for storage and determination of major seawater anions by ion chromatography (Dionex 4500i) in the home laboratory. For determinations of trace metals, rainwater samples were analysed by ICP-MS (Agilent 7500CS and Thermo Element 2) at the National High Magnetic Field Laboratory at Florida State University (FSU). All sample handling was performed under a Class 100 laminar flow hood.
Trace metal concentrations in the reagent blank (0.024 M HCl) were subtracted from all rainwater samples. Filtration blanks were prepared by passing 100 mL of deionized water through GN-6 filters positioned in the filter assembly and subtracted from filtered rainwater samples. Filter blanks averaged 0.034 ± 0.01 µg/L dissolved Fe (representing an average of 1.2% of the Fe sample concentrations). Relative standard deviations of replicate analyses averaged 10% for Fe in rainwater.
Concentrations below the detection limit are represented as 'below_DL' (originally "<_DL"). See the Supplemental Files section for Detection Limits.
Quality flag definitions:
BDL = below detection limit (detection limit = 3 standard deviations of the blank).
0 = No QC performed.
1 = Good data.
2 = Probably good data.
3 = Probably bad data that is potentially correctable.
4 = Bad data.
5 = Value changed.
6 = Sample < blank.
7 = Outlier (unexplained data point or sample).
8 = Interpolated value.
9 = Missing value.
F = Filtered sample.
BCO-DMO made the following modifications:
- Replaced blanks with 'nd'.
- Replaced ' < DL' with 'below_DL'.
- Changed PI-supplied cruise IDs of KN204-4 and KN204-5 to KN204-01A and KN204-01B. Added 'cruise_part' column to distingush between parts A and B of cruise KN204-01.
- Copied averages and variances from the 3rd sub_sample to the all 3 sub_sample rows (where applicable).
Additional GEOTRACES Processing:
After the data were submitted to the International Data Management Office, BODC, the office noticed that important identifying information was missing in many datasets. With the agreement of BODC and the US GEOTRACES lead PIs, BCO-DMO added standard US GEOTRACES information, such as the US GEOTRACES event number, to each submitted dataset lacking this information. To accomplish this, BCO-DMO compiled a 'master' dataset composed of the following parameters: station_GEOTRC, cast_GEOTRC (bottle and pump data only), event_GEOTRC, sample_GEOTRC, sample_bottle_GEOTRC (bottle data only), bottle_GEOTRC (bottle data only), depth_GEOTRC_CTD (bottle data only), depth_GEOTRC_CTD_rounded (bottle data only), BTL_ISO_DateTime_UTC (bottle data only), and GeoFish_id (GeoFish data only). This added information will facilitate subsequent analysis and inter comparison of the datasets.
Bottle parameters in the master file were taken from the GT-C_Bottle_GT10, GT-C_Bottle_GT11, ODF_Bottle_GT10, and ODF_Bottle_GT11 datasets. Non-bottle parameters, including those from GeoFish tows, Aerosol sampling, and McLane Pumps, were taken from the Event_Log_GT10 and Event_Log_GT11 datasets. McLane pump cast numbers missing in event logs were taken from the Particulate Th-234 dataset submitted by Ken Buesseler.
A standardized BCO-DMO method (called "join") was then used to merge the missing parameters to each US GEOTRACES dataset, most often by matching on sample_GEOTRC or on some unique combination of other parameters.
If the master parameters were included in the original data file and the values did not differ from the master file, the original data columns were retained and the names of the parameters were changed from the PI-submitted names to the standardized master names. If there were differences between the PI-supplied parameter values and those in the master file, both columns were retained. If the original data submission included all of the master parameters, no additional columns were added, but parameter names were modified to match the naming conventions of the master file.
See the dataset parameters documentation for a description of which parameters were supplied by the PI and which were added via the join method.
| File |
|---|
Unfiltered_Rain_GT10-11_joined.csv (Comma Separated Values (.csv), 10.73 KB) MD5:b0f2dfd90236c6f27f9d53b8eb3e59a7 Primary data file for dataset ID 3858 |
| File |
|---|
3858_Unfiltered_Rainwater_Detection_Limits.pdf (Portable Document Format (.pdf), 540.75 KB) MD5:1c11a07ed03634a82eb4d125b882b54c Detection Limits for dataset 3858 - GT10-11 - Unfiltered Rainwater (PI: William Landing) |
| Parameter | Description | Units |
| cruise_id | Official cruise identifier e.g. KN199-04 = R/V Knorr cruise number 199-04. | text |
| cruise_part | Part of cruise. For KN204-01: A = 11/6/2011 to 11/18/2011 (Woods Hole to Bermuda) B = 11/19/2011 to 12/11/2011 (Bermuda to Praia, Cabo Verde) | text |
| sample_GEOTRC | Unique identifying number for US GEOTRACES samples; ranges from 5033 to 6078 for KN199-04 and from 6112 to 8148 for KN204-01. PI-supplied values were identical to those in the intermediate US GEOTRACES master file. Originally submitted as 'Sample #', this parameter name has been changed to conform to BCO-DMO's GEOTRACES naming conventions. | unitless |
| sub_sample | Sub-sample number. | unitless |
| julian_day | Julian day at start of sampling event. | |
| day_start | 2-digit day of month at start of sampling event. | dd (01 to 31) |
| month_start | 2-digit month of year at start of sampling event. | mm (01 to 12) |
| year_start | 4-digit year at start of sampling event. | YYYY |
| time_start_utc | Time (UTC) at start of sampling event. 24-hour clock. | HHMM |
| lat_start | Latitude at start of sampling event. North = Positive. | decimal degrees |
| lon_start | Longitude at start of sampling event. West = Negative. | decimal degrees |
| day_end | 2-digit day of month at end of sampling event. | dd (01 to 31) |
| month_end | 2-digit month of year at end of sampling event. | mm (01 to 12) |
| year_end | 4-digit year at end of sampling event. | YYYY |
| time_end_utc | Time (UTC) at end of sampling event. 24-hour clock. | HHMM |
| lat_end | Latitude at end of sampling event. North = Positive. | decimal degrees |
| lon_end | Longitude at end of sampling event. West = Negative. | decimal degrees |
| rain_depth | Rain depth (mm; based on funnel diameter of 279.4 mm). | millimeters |
| Li | Unfiltered rainwater Li (Lithium) concentration. | ug/L |
| Li_avg | Unfiltered rainwater Li concentration average of sub_samples within a sample. | ug/L |
| Li_var | Unfiltered rainwater Li concentration variance of sub_samples within a sample. | ug/L |
| Li_flag | Unfiltered rainwater Li concentration data quality flag. | unitless |
| Na | Unfiltered rainwater Na (Sodium) concentration. | ug/L |
| Na_avg | Unfiltered rainwater Na concentration average of sub_samples within a sample. | ug/L |
| Na_var | Unfiltered rainwater Na concentration variance of sub_samples within a sample. | ug/L |
| Na_flag | Unfiltered rainwater Na concentration data quality flag. | unitless |
| Mg | Unfiltered rainwater Mg (Magnesium) concentration. | ug/L |
| Mg_avg | Unfiltered rainwater Mg concentration average of sub_samples within a sample. | ug/L |
| Mg_var | Unfiltered rainwater Mg concentration variance of sub_samples within a sample. | ug/L |
| Mg_flag | Unfiltered rainwater Mg concentration data quality flag. | unitless |
| Al | Unfiltered rainwater Al (Aluminum) concentration. | ug/L |
| Al_avg | Unfiltered rainwater Al concentration average of sub_samples within a sample. | ug/L |
| Al_var | Unfiltered rainwater Al concentration variance of sub_samples within a sample. | ug/L |
| Al_flag | Unfiltered rainwater Al concentration data quality flag. | unitless |
| P | Unfiltered rainwater P (Phosphorus) concentration. | ug/L |
| P_avg | Unfiltered rainwater P concentration average of sub_samples within a sample. | ug/L |
| P_var | Unfiltered rainwater P concentration variance of sub_samples within a sample. | ug/L |
| P_flag | Unfiltered rainwater P concentration data quality flag. | unitless |
| Ti | Unfiltered rainwater Ti (Titanium) concentration. | ug/L |
| Ti_avg | Unfiltered rainwater Ti concentration average of sub_samples within a sample. | ug/L |
| Ti_var | Unfiltered rainwater Ti concentration variance of sub_samples within a sample. | ug/L |
| Ti_flag | Unfiltered rainwater Ti concentration data quality flag. | unitless |
| V | Unfiltered rainwater V (Vanadium) concentration. | ug/L |
| V_avg | Unfiltered rainwater V concentration average of sub_samples within a sample. | ug/L |
| V_var | Unfiltered rainwater V concentration variance of sub_samples within a sample. | ug/L |
| V_flag | Unfiltered rainwater V concentration data quality flag. | unitless |
| Cr | Unfiltered rainwater Cr (Chromium) concentration. | ug/L |
| Cr_avg | Unfiltered rainwater Cr concentration average of sub_samples within a sample. | ug/L |
| Cr_var | Unfiltered rainwater Cr concentration variance of sub_samples within a sample. | ug/L |
| Cr_flag | Unfiltered rainwater Cr concentration data quality flag. | unitless |
| Mn | Unfiltered rainwater Mn (Manganese) concentration. | ug/L |
| Mn_avg | Unfiltered rainwater Mn concentration average of sub_samples within a sample. | ug/L |
| Mn_var | Unfiltered rainwater Mn concentration variance of sub_samples within a sample. | ug/L |
| Mn_flag | Unfiltered rainwater Mn concentration data quality flag. | unitless |
| Fe | Unfiltered rainwater Fe (Iron) concentration. | ug/L |
| Fe_avg | Unfiltered rainwater Fe concentration average of sub_samples within a sample. | ug/L |
| Fe_var | Unfiltered rainwater Fe concentration variance of sub_samples within a sample. | ug/L |
| Fe_flag | Unfiltered rainwater Fe concentration data quality flag. | unitless |
| Co | Unfiltered rainwater Co (Cobalt) concentration. | ug/L |
| Co_avg | Unfiltered rainwater Co concentration average of sub_samples within a sample. | ug/L |
| Co_var | Unfiltered rainwater Co concentration variance of sub_samples within a sample. | ug/L |
| Co_flag | Unfiltered rainwater Co concentration data quality flag. | unitless |
| Ni | Unfiltered rainwater Ni (Nickel) concentration. | ug/L |
| Ni_avg | Unfiltered rainwater Ni concentration average of sub_samples within a sample. | ug/L |
| Ni_var | Unfiltered rainwater Ni concentration variance of sub_samples within a sample. | ug/L |
| Ni_flag | Unfiltered rainwater Ni concentration data quality flag. | unitless |
| Cu | Unfiltered rainwater Cu (Copper) concentration. | ug/L |
| Cu_avg | Unfiltered rainwater Cu concentration average of sub_samples within a sample. | ug/L |
| Cu_var | Unfiltered rainwater Cu concentration variance of sub_samples within a sample. | ug/L |
| Cu_flag | Unfiltered rainwater Cu concentration data quality flag. | unitless |
| Zn | Unfiltered rainwater Zn (Zinc) concentration. | ug/L |
| Zn_avg | Unfiltered rainwater Zn concentration average of sub_samples within a sample. | ug/L |
| Zn_var | Unfiltered rainwater Zn concentration variance of sub_samples within a sample. | ug/L |
| Zn_flag | Unfiltered rainwater Zn concentration data quality flag. | unitless |
| As | Unfiltered rainwater As (Arsenic) concentration. | ug/L |
| As_avg | Unfiltered rainwater As concentration average of sub_samples within a sample. | ug/L |
| As_var | Unfiltered rainwater As concentration variance of sub_samples within a sample. | ug/L |
| As_flag | Unfiltered rainwater As concentration data quality flag. | unitless |
| Se | Unfiltered rainwater Se (Selenium) concentration. | ug/L |
| Se_avg | Unfiltered rainwater Se concentration average of sub_samples within a sample. | ug/L |
| Se_var | Unfiltered rainwater Se concentration variance of sub_samples within a sample. | ug/L |
| Se_flag | Unfiltered rainwater Se concentration data quality flag. | unitless |
| Rb | Unfiltered rainwater Rb (Rubidium) concentration. | ug/L |
| Rb_avg | Unfiltered rainwater Rb concentration average of sub_samples within a sample. | ug/L |
| Rb_var | Unfiltered rainwater Rb concentration variance of sub_samples within a sample. | ug/L |
| Rb_flag | Unfiltered rainwater Rb concentration data quality flag. | unitless |
| Sr | Unfiltered rainwater Sr (Strontium) concentration. | ug/L |
| Sr_avg | Unfiltered rainwater Sr concentration average of sub_samples within a sample. | ug/L |
| Sr_var | Unfiltered rainwater Sr concentration variance of sub_samples within a sample. | ug/L |
| Sr_flag | Unfiltered rainwater Sr concentration data quality flag. | unitless |
| Zr | Unfiltered rainwater Zr (Zirconium) concentration. | ug/L |
| Zr_avg | Unfiltered rainwater Zr concentration average of sub_samples within a sample. | ug/L |
| Zr_var | Unfiltered rainwater Zr concentration variance of sub_samples within a sample. | ug/L |
| Zr_flag | Unfiltered rainwater Zr concentration data quality flag. | unitless |
| Cd | Unfiltered rainwater Cd (Cadmium) concentration. | ug/L |
| Cd_avg | Unfiltered rainwater Cd concentration average of sub_samples within a sample. | ug/L |
| Cd_var | Unfiltered rainwater Cd concentration variance of sub_samples within a sample. | ug/L |
| Cd_flag | Unfiltered rainwater Cd concentration data quality flag. | unitless |
| Sn | Unfiltered rainwater Sn (Tin) concentration. | ug/L |
| Sn_avg | Unfiltered rainwater Sn concentration average of sub_samples within a sample. | ug/L |
| Sn_var | Unfiltered rainwater Sn concentration variance of sub_samples within a sample. | ug/L |
| Sn_flag | Unfiltered rainwater Sn concentration data quality flag. | unitless |
| Sb | Unfiltered rainwater Sb (Antimony) concentration. | ug/L |
| Sb_avg | Unfiltered rainwater Sb concentration average of sub_samples within a sample. | ug/L |
| Sb_var | Unfiltered rainwater Sb concentration variance of sub_samples within a sample. | ug/L |
| Sb_flag | Unfiltered rainwater Sb concentration data quality flag. | unitless |
| Cs | Unfiltered rainwater Cs (Caesium) concentration. | ug/L |
| Cs_avg | Unfiltered rainwater Cs concentration average of sub_samples within a sample. | ug/L |
| Cs_var | Unfiltered rainwater Cs concentration variance of sub_samples within a sample. | ug/L |
| Cs_flag | Unfiltered rainwater Cs concentration data quality flag. | unitless |
| Ba | Unfiltered rainwater Ba (Barium) concentration. | ug/L |
| Ba_avg | Unfiltered rainwater Ba concentration average of sub_samples within a sample. | ug/L |
| Ba_var | Unfiltered rainwater Ba concentration variance of sub_samples within a sample. | ug/L |
| Ba_flag | Unfiltered rainwater Ba concentration data quality flag. | unitless |
| La | Unfiltered rainwater La (Lanthanum) concentration. | ug/L |
| La_avg | Unfiltered rainwater La concentration average of sub_samples within a sample. | ug/L |
| La_var | Unfiltered rainwater La concentration variance of sub_samples within a sample. | ug/L |
| La_flag | Unfiltered rainwater La concentration data quality flag. | unitless |
| Ce | Unfiltered rainwater Ce (Cerium) concentration. | ug/L |
| Ce_avg | Unfiltered rainwater Ce concentration average of sub_samples within a sample. | ug/L |
| Ce_var | Unfiltered rainwater Ce concentration variance of sub_samples within a sample. | ug/L |
| Ce_flag | Unfiltered rainwater Ce concentration data quality flag. | unitless |
| Nd | Unfiltered rainwater Nd (Neodymium) concentration. | ug/L |
| Nd_avg | Unfiltered rainwater Nd concentration average of sub_samples within a sample. | ug/L |
| Nd_var | Unfiltered rainwater Nd concentration variance of sub_samples within a sample. | ug/L |
| Nd_flag | Unfiltered rainwater Nd concentration data quality flag. | unitless |
| Pb | Unfiltered rainwater Pb (Lead) concentration. | ug/L |
| Pb_avg | Unfiltered rainwater Pb concentration average of sub_samples within a sample. | ug/L |
| Pb_var | Unfiltered rainwater Pb concentration variance of sub_samples within a sample. | ug/L |
| Pb_flag | Unfiltered rainwater Pb concentration data quality flag. | unitless |
| Th | Unfiltered rainwater Th (Thorium) concentration. | ug/L |
| Th_avg | Unfiltered rainwater Th concentration average of sub_samples within a sample. | ug/L |
| Th_var | Unfiltered rainwater Th concentration variance of sub_samples within a sample. | ug/L |
| Th_flag | Unfiltered rainwater Th concentration data quality flag. | unitless |
| U | Unfiltered rainwater U (Uranium) concentration. | ug/L |
| U_avg | Unfiltered rainwater U concentration average of sub_samples within a sample. | ug/L |
| U_var | Unfiltered rainwater U concentration variance of sub_samples within a sample. | ug/L |
| U_flag | Unfiltered rainwater U concentration data quality flag. | unitless |
| Cl | Unfiltered rainwater Cl (Chlorine) concentration. | mg/L |
| Cl_avg | Unfiltered rainwater Cl concentration average of sub_samples within a sample. | mg/L |
| Cl_var | Unfiltered rainwater Cl concentration variance of sub_samples within a sample. | mg/L |
| Cl_flag | Unfiltered rainwater Cl concentration data quality flag. | unitless |
| NO3 | Unfiltered rainwater NO3 (Nitrate) concentration. | mg/L |
| NO3_avg | Unfiltered rainwater NO3 concentration average of sub_samples within a sample. | mg/L |
| NO3_var | Unfiltered rainwater NO3 concentration variance of sub_samples within a sample. | mg/L |
| NO3_flag | Unfiltered rainwater NO3 concentration data quality flag. | unitless |
| nss_SO4 | Unfiltered rainwater nssSO4 (non-sea salt SO4) concentration. | mg/L |
| nss_SO4_avg | Unfiltered rainwater nssSO4 (non-sea salt SO4) concentration average of sub_samples within a sample. | mg/L |
| nss_SO4_var | Unfiltered rainwater nssSO4 (non-sea salt SO4) concentration variance of sub_samples within a sample. | mg/L |
| nss_SO4_flag | Unfiltered rainwater nssSO4 (non-sea salt SO4) concentration data quality flag. | unitless |
| station_GEOTRC | GEOTRACES station number; ranges from 1 through 12 for KN199-04 and 1 through 24 for KN204-01. Stations 7 and 9 were skipped on KN204-01. Some GeoFish stations are denoted as X_to_Y indicating the tow occurred between stations X and Y. Values were added from the intermediate US GEOTRACES master file (see Processing Description). | unitless |
| event_GEOTRC | Unique identifying number for US GEOTRACES sampling events; ranges from 2001 to 2225 for KN199-04 events and from 3001 to 3282 for KN204-01 events. Values were added from the intermediate US GEOTRACES master file (see Processing Description). | unitless |
| ISO_DateTime_UTC_start | Date and time (UTC) variable recorded at the start of sampling time in ISO compliant format. Values were added from the intermediate US GEOTRACES master file (see Processing Description). This standard is based on ISO 8601:2004(E) and takes on the following form: 2009-08-30T14:05:00[.xx]Z (UTC time) | YYYY-MM-DDTHH:MM:SS[.xx][+/-TZ] |
| ISO_DateTime_UTC_end | Date and time (UTC) variable recorded at the end of sampling time in ISO compliant format. Values were added from the intermediate US GEOTRACES master file (see Processing Description). This standard is based on ISO 8601:2004(E) and takes on the following form: 2009-08-30T14:05:00[.xx]Z (UTC time) | YYYY-MM-DDTHH:MM:SS[.xx][+/-TZ] |
| Dataset-specific Instrument Name | Inductively Coupled Plasma Mass Spectrometer |
| Generic Instrument Name | Inductively Coupled Plasma Mass Spectrometer |
| Dataset-specific Description | For determinations of trace metals, rainwater samples were analysed by ICP-MS (Agilent 7500CS and Thermo Element 2) at the National High Magnetic Field Laboratory at Florida State University (FSU). |
| Generic Instrument Description | An ICP Mass Spec is an instrument that passes nebulized samples into an inductively-coupled gas plasma (8-10000 K) where they are atomized and ionized. Ions of specific mass-to-charge ratios are quantified in a quadrupole mass spectrometer. |
| Dataset-specific Instrument Name | Ion Chromatograph |
| Generic Instrument Name | Ion Chromatograph |
| Dataset-specific Description | Major anions were determined by ion chromatography (Dionex 4500i). |
| Generic Instrument Description | Ion chromatography is a form of liquid chromatography that measures concentrations of ionic species by separating them based on their interaction with a resin. Ionic species separate differently depending on species type and size. Ion chromatographs are able to measure concentrations of major anions, such as fluoride, chloride, nitrate, nitrite, and sulfate, as well as major cations such as lithium, sodium, ammonium, potassium, calcium, and magnesium in the parts-per-billion (ppb) range. (from http://serc.carleton.edu/microbelife/research_methods/biogeochemical/ic....) |
| Dataset-specific Instrument Name | Precipitation Sampler |
| Generic Instrument Name | Precipitation Sampler |
| Dataset-specific Description | Rain samples were collected using an N-CON precipitation sampler (model 00-120-2). See the product information sheet. |
| Generic Instrument Description | A device that collects a sample of precipitation (rain, hail or snow) as it falls. |
KN199-04
| Website | |
| Platform | R/V Knorr |
| Report | |
| Start Date | 2010-10-15 |
| End Date | 2010-11-04 |
| Description | This cruise constitutes the first survey section as part of the U.S. participation in an international program named GEOTRACES.
Funding: NSF OCE award 0926423
Science Objectives: To obtain state of the art trace metal and isotope measurements on a suite of samples taken on a mid-latitude zonal transect of the North Atlantic. In particular, sampling targeted the oxygen minimum zone extending off the west African coast near Mauritania, the TAG hydrothermal field, and the western boundary current system along Line W. For additional information, please refer to the GEOTRACES program Web site (https://www.geotraces.org/) for overall program objectives and a summary of properties measured.
Science Activities include seawater sampling via GoFLO and Niskin carousels, in situ pumping (and filtration), CTDO2 and transmissometer sensors, underway pumped sampling of surface waters, and collection of aerosols and rain. Hydrography, CTD and nutrient measurements were supported by the Ocean Data Facility (J. Swift) at Scripps Institution of Oceanography and funded through NSF Facilities. They provided an additional CTD rosette system along with nephelometer and LADCP. A trace metal clean Go-Flo Rosette and winch were provided by the group at Old Dominion University (G. Cutter) along with a towed underway pumping system.
Additional cruise information is available from the Rolling Deck to Repository (R2R): https://www.rvdata.us/search/cruise/KN199-04
Other Relevant Links:
List of cruise participants: [ PDF ]
Cruise track: JPEG image (from Woods Hole Oceanographic Institution, vessel operator)
ADCP data are available from the Currents ADCP group at the University of Hawaii: KN199-04 ADCP |
KN204-01
| Website | |
| Platform | R/V Knorr |
| Report | |
| Start Date | 2011-11-06 |
| End Date | 2011-12-11 |
| Description | The US GEOTRACES North Atlantic cruise aboard the R/V Knorr completed the section between Lisbon and Woods Hole that began in October 2010 but was rescheduled for November-December 2011. The R/V Knorr made a brief stop in Bermuda to exchange samples and personnel before continuing across the basin. Scientists disembarked in Praia, Cape Verde, on 11 December. The cruise was identified as KN204-01A (first part before Bermuda) and KN204-01B (after the Bermuda stop). However, the official deployment name for this cruise is KN204-01 and includes both part A and B.
Science activities included: ODF 30 liter rosette CTD casts, ODU Trace metal rosette CTD casts, McLane particulate pump casts, underway sampling with towed fish and sampling from the shipboard "uncontaminated" flow-through system.
Full depth stations are shown in the accompanying figure (see below). Additional stations to sample for selected trace metals to a depth of 1000 m are not shown. Standard stations are shown in red (as are the ports) and "super" stations, with extra casts to provide large-volume samples for selected parameters, are shown in green.
Station spacing is concentrated along the western margin to evaluate the transport of trace elements and isotopes by western boundary currents. Stations across the gyre will allow scientists to examine trace element supply by Saharan dust, while also contrasting trace element and isotope distributions in the oligotrophic gyre with conditions near biologically productive ocean margins, both in the west, to be sampled now, and within the eastern boundary upwelling system off Mauritania, sampled last year.
Funding: The cruise was funded by NSF OCE awards 0926204, 0926433 and 0926659.
Additional cruise information is available from the Rolling Deck to Repository (R2R): https://www.rvdata.us/search/cruise/KN204-01
Other Relevant Links:
ADCP data are available from the Currents ADCP group at the University of Hawaii at the links below:KN204-01A (part 1 of 2011 cruise; Woods Hole, MA to Bermuda)KN204-01B (part 2 of 2011 cruise; Bermuda to Cape Verde) |
U.S. GEOTRACES North Atlantic Transect (GA03) (U.S. GEOTRACES NAT)
Much of this text appeared in an article published in OCB News, October 2008, by the OCB Project Office.
The first U.S. GEOTRACES Atlantic Section will be specifically centered around a sampling cruise to be carried out in the North Atlantic in 2010. Ed Boyle (MIT) and Bill Jenkins (WHOI) organized a three-day planning workshop that was held September 22-24, 2008 at the Woods Hole Oceanographic Institution. The main goal of the workshop, sponsored by the National Science Foundation and the U.S. GEOTRACES Scientific Steering Committee, was to design the implementation plan for the first U.S. GEOTRACES Atlantic Section. The primary cruise design motivation was to improve knowledge of the sources, sinks and internal cycling of Trace Elements and their Isotopes (TEIs) by studying their distributions along a section in the North Atlantic (Figure 1). The North Atlantic has the full suite of processes that affect TEIs, including strong meridional advection, boundary scavenging and source effects, aeolian deposition, and the salty Mediterranean Outflow. The North Atlantic is particularly important as it lies at the "origin" of the global Meridional Overturning Circulation.
It is well understood that many trace metals play important roles in biogeochemical processes and the carbon cycle, yet very little is known about their large-scale distributions and the regional scale processes that affect them. Recent advances in sampling and analytical techniques, along with advances in our understanding of their roles in enzymatic and catalytic processes in the open ocean provide a natural opportunity to make substantial advances in our understanding of these important elements. Moreover, we are motivated by the prospect of global change and the need to understand the present and future workings of the ocean's biogeochemistry. The GEOTRACES strategy is to measure a broad suite of TEIs to constrain the critical biogeochemical processes that influence their distributions. In addition to these "exotic" substances, more traditional properties, including macronutrients (at micromolar and nanomolar levels), CTD, bio-optical parameters, and carbon system characteristics will be measured. The cruise starts at Line W, a repeat hydrographic section southeast of Cape Cod, extends to Bermuda and subsequently through the North Atlantic oligotrophic subtropical gyre, then transects into the African coast in the northern limb of the coastal upwelling region. From there, the cruise goes northward into the Mediterranean outflow. The station locations shown on the map are for the "fulldepth TEI" stations, and constitute approximately half of the stations to be ultimately occupied.
Figure 1. The proposed 2010 Atlantic GEOTRACES cruise track plotted on dissolved oxygen at 400 m depth. Data from the World Ocean Atlas (Levitus et al., 2005) were plotted using Ocean Data View (courtesy Reiner Schlitzer). [click on the image to view a larger version]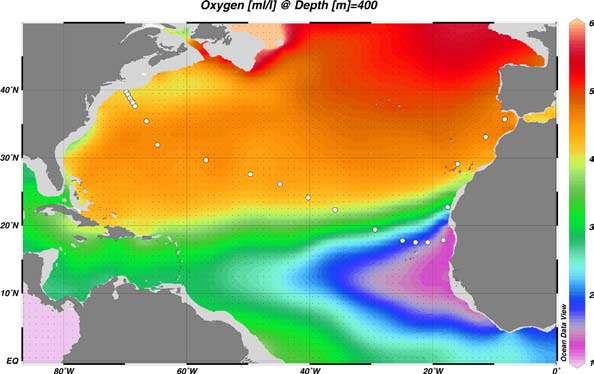
Hydrography, CTD and nutrient measurements will be supported by the Ocean Data Facility (J. Swift) at Scripps Institution of Oceanography and funded through NSF Facilities. They will be providing an additional CTD rosette system along with nephelometer and LADCP. A trace metal clean Go-Flo Rosette and winch will be provided by the group at Old Dominion University (G. Cutter) along with a towed underway pumping system.
The North Atlantic Transect cruise began in 2010 with KN199 leg 4 (station sampling) and leg 5 (underway sampling only) (Figure 2).
Figure 2. The red line shows the cruise track for the first leg of the US Geotraces North Atlantic Transect on the R/V Knorr in October 2010. The rest of the stations (beginning with 13) will be completed in October-December 2011 on the R/V Knorr (courtesy of Bill Jenkins, Chief Scientist, GNAT first leg). [click on the image to view a larger version]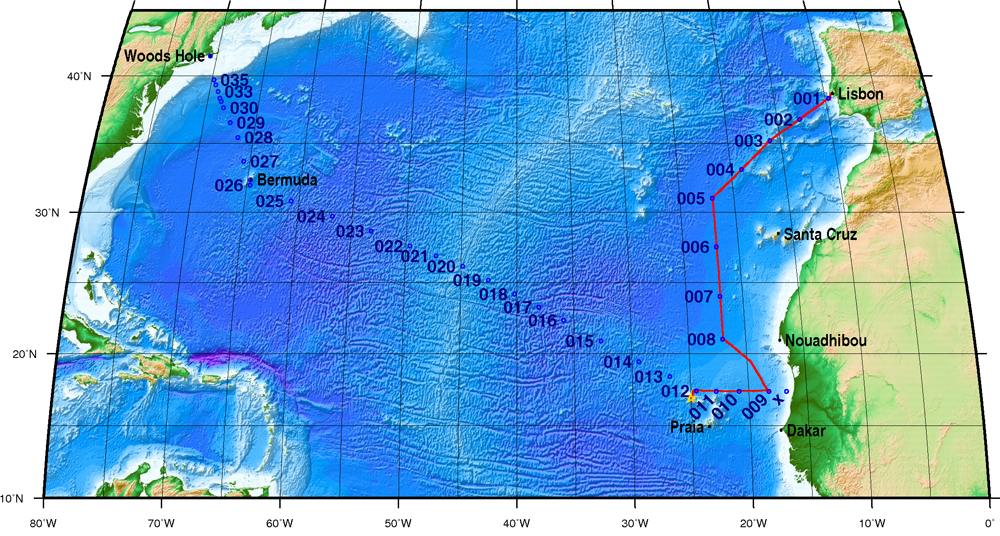
The section completion effort resumed again in November 2011 with KN204-01A,B (Figure 3).
KN204-01A,B Cruise Report (PDF)
Figure 3. Station locations occupied on the US Geotraces North Atlantic Transect on the R/V Knorr in November 2011. [click on the image to view a larger version]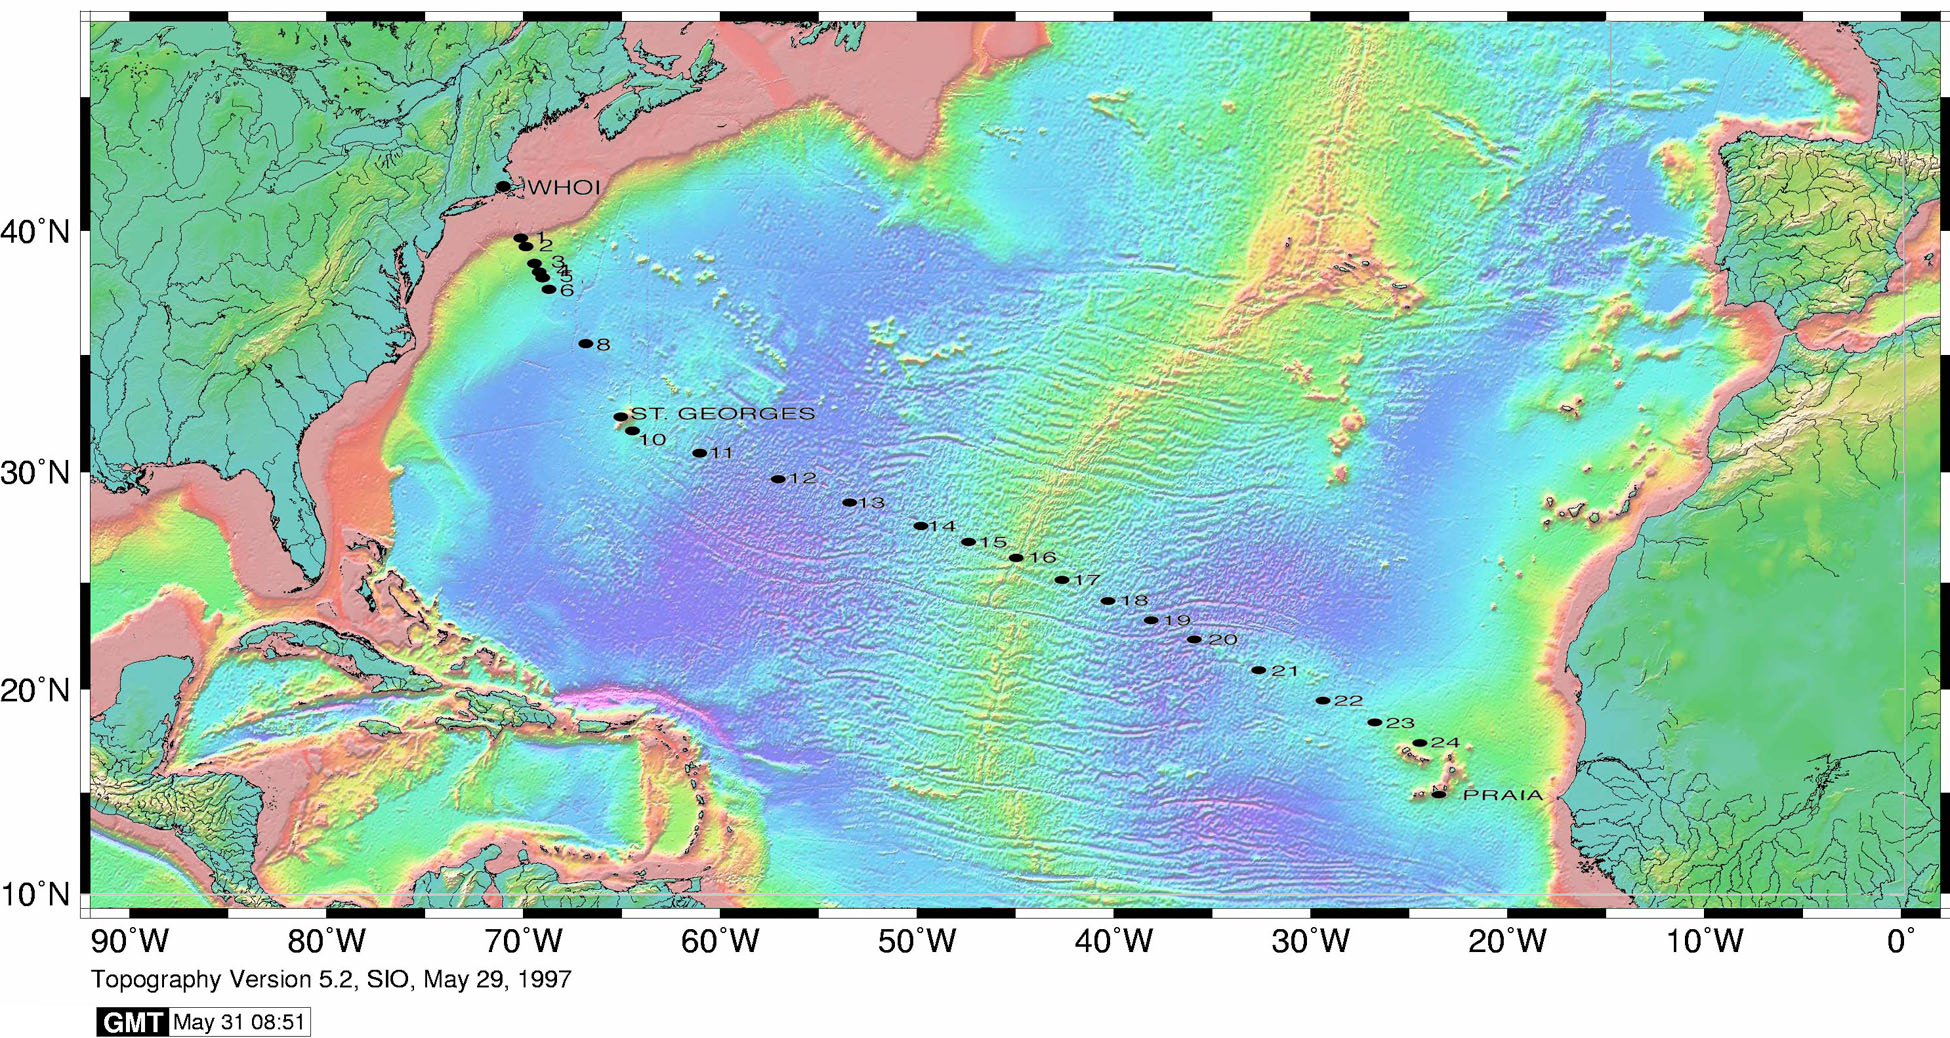
Data from the North Atlantic Transect cruises are available under the Datasets heading below, and consensus values for the SAFe and North Atlantic GEOTRACES Reference Seawater Samples are available from the GEOTRACES Program Office: Standards and Reference Materials
ADCP data are available from the Currents ADCP group at the University of Hawaii at the links below:
KN199-04 (leg 1 of 2010 cruise; Lisbon to Cape Verde)
KN199-05 (leg 2 of 2010 cruise; Cape Verde to Charleston, NC)
KN204-01A (part 1 of 2011 cruise; Woods Hole, MA to Bermuda)
KN204-01B (part 2 of 2011 cruise; Bermuda to Cape Verde)
U.S. GEOTRACES (U.S. GEOTRACES)
GEOTRACES is a SCOR sponsored program; and funding for program infrastructure development is provided by the U.S. National Science Foundation.
GEOTRACES gained momentum following a special symposium, S02: Biogeochemical cycling of trace elements and isotopes in the ocean and applications to constrain contemporary marine processes (GEOSECS II), at a 2003 Goldschmidt meeting convened in Japan. The GEOSECS II acronym referred to the Geochemical Ocean Section Studies To determine full water column distributions of selected trace elements and isotopes, including their concentration, chemical speciation, and physical form, along a sufficient number of sections in each ocean basin to establish the principal relationships between these distributions and with more traditional hydrographic parameters;
* To evaluate the sources, sinks, and internal cycling of these species and thereby characterize more completely the physical, chemical and biological processes regulating their distributions, and the sensitivity of these processes to global change; and
* To understand the processes that control the concentrations of geochemical species used for proxies of the past environment, both in the water column and in the substrates that reflect the water column.
GEOTRACES will be global in scope, consisting of ocean sections complemented by regional process studies. Sections and process studies will combine fieldwork, laboratory experiments and modelling. Beyond realizing the scientific objectives identified above, a natural outcome of this work will be to build a community of marine scientists who understand the processes regulating trace element cycles sufficiently well to exploit this knowledge reliably in future interdisciplinary studies.
Expand "Projects" below for information about and data resulting from individual US GEOTRACES research projects.
| Funding Source | Award |
|---|---|
| NSF Division of Ocean Sciences (NSF OCE) | |
| NSF Division of Ocean Sciences (NSF OCE) | |
| NSF Division of Ocean Sciences (NSF OCE) |
[ table of contents | back to top ]