Particle beam attenuation coefficient (Cp) data from ODF (Ocean Data Facility) rosette, R/V Knorr KN199-04, KN204-01 in the Subtropical northern Atlantic Ocean, 2010-2011 (U.S. GEOTRACES NAT project)
Project
Program
| Contributors | Affiliation | Role |
|---|---|---|
| Anderson, Robert F. | Lamont-Doherty Earth Observatory (LDEO) | Principal Investigator |
| Fleisher, Martin Q. | Lamont-Doherty Earth Observatory (LDEO) | Co-Principal Investigator |
| Hayes, Christopher T. | Lamont-Doherty Earth Observatory (LDEO) | Student, Contact |
| Copley, Nancy | Woods Hole Oceanographic Institution (WHOI BCO-DMO) | BCO-DMO Data Manager |
Calibrated transmissometer data (particle beam attenuation coefficient, Cp) for the two deployed transmissometers (trace-metal clean Geotraces Carousel, GT-C; and the Ocean Data Facility conventional rosette, ODF, also known as the SIOR rosette). The transmissometers were WET Labs, Inc., 25 cm pathlength, C-Star transmissometer (660 nm). Traditional CTD readings (pressure, temp, sal, oxygen, depth) are reproduced here for convenience. Metadata for data other than Cp reported here should be consulted.
NOTE: Revised dataset was served on 5 Nov. 2013.
Please note that data may not be final, pending intercalibration results and further analysis. If you are interested in following changes to US GEOTRACES data, there is an RSS feed available from the GEOTRACES-NAT project page.
Calibrating the transmissometer data from the Geotraces North Atlantic Transect
Christopher Hayes (Lamont-Doherty Earth Observatory of Columbia University)
The Geotraces North Atlantic Transect consisted of two legs: KN199-4 (aka GT10) and K204 (aka GT11). Transmissometer data was collected on three deployment systems during these cruises: (1) the Geotraces rosette or carousel (GT-C) which collected contamination prone elements in Go-Flo bottles, (2) a conventional Niskin bottle rosette operated by the Ocean Data Facility out of Scripps (ODF) and (3) a CTD attached to the end of the wire used for deploying in-situ pumps (PUMP). This document describes calibration of the raw voltages (from downcasts) recorded from the ODF and GT-C transmissometers and how they were calibrated into particle beam attenuation coefficients (Cp) which should be independent of the collection system. In this calibration the PUMP data was consulted but it will be submitted separately.
Equations used (from GEOTRACES protocols, 2010; see also Bishop and Wood, 2008):
[V_CTD_ref - V_CTD_dark ] = (V_factory_ref - V_factory_dark) *
(V_CTD_air - V_CTD_dark) / (V_factory_air - V_factory_dark)
Transmission (tr.) = (V_obs - V_CTD_dark) / [V_CTD_ref - V_CTD_dark ]
Cp = - 4 * ln(tr.)
V_factory_ref is the maximum voltage as reported by the factory
V_factory_dark is the minimum voltage (blocked path) as reported by the factory
V_factory_air is the voltage reading in clean air as reported by the factory
V_CTD_air is the voltage reading in clean air (cleaned windows) reported on board
V_CTD_dark is the minimum (blocked path) voltage reading reported on board
V_obs is the voltage reading observed during the cast
Cp is calculated here for a 25 cm path length transmissometer and is in units of [1/m].
V_CTD_air and V_CTD_dark were checked routinely at sea for the PUMP on both cruises and only occasionally on the second cruise for the GT-C and ODF. The transmissometer windows were cleaned routinely for the PUMP and GT-C on both cruises and periodically for the ODF system. Based on the relatively stability of voltages at the particle minimum (~3 km depth) for the PUMP and GT-C systems, there do not appear to be significant drift issues. This was not true for the ODF system.
The calibration equations calculations, using the shipboard voltage readings result in negative Cp values (>100% transmission) for both the GT-C and PUMP systems because the V_factory_ref is too low (presumably the distilled water used in factory calibration is more particle-rich than seawater). The maximum voltage for each system therefore had to be tuned (values listed below). The cruise-wide maximum transmission was set to about 0.997 which occurs in the deep western basin (cruise KN204 or GT11, station 12). The data from the first leg of the cruise (KN199-4 or GT10) was tuned so that the Cp profiles matched in deep water at the cross-over station (TENATSO = GT11 station 24 = GT10 station 12).
There was significant variability in the background (deep water) values on the ODF system. Either ODF had drift or windows weren’t always cleaned between casts. There was also a problem with the profile shape of the transmissometer data collected by the ODF cast. The maximum voltage on the ODF casts was reached at ~1km rather than 2-3km from PUMP and GT-C. I have attempted to correct the ODF data for drift by matching Cp values at the clear water minimum (~3 km depth) with the PUMP and GT-C casts, but the profile shape problem cannot be corrected for. I therefore do not recommend using the ODF transmissometer data quantitatively; although, for large beam attenuation signals like nepheloid layers or the hydrothermal plume, Cp estimated from the ODF casts is most likely a reasonable estimate.
The Cp results for the PUMP and GT-C casts generally appear internally consistent. The PUMP did not produce reliable voltage readings for the full water column at GT10 station 11 and GT11 stations 2 and 6. The GT-C casts also sampled demi-stations, shallow casts halfway between the full depth stations. One other factor about the data collection is that the during the GT-C downcasts, there was uninterrupted descent of the transmissometer (whereas during the PUMP up- and down- casts the transmissometer is stalled during deployment and retrieval of each pump from the wire). The GT-C rosette, however, did not sample at GT11 station 4, because of time constraints. This is unfortunate because this station was observed to have most particle rich nepheloid layer of the entire cruise. In order to have one file with Cp for all the deep stations, I have pasted in the Cp values measured by the PUMP system at GT11 station 4 into the GT-C data and did a slight adjustment so the deep background values matched between the surround stations 3 and 6 (GT11) in the GT-C casts.
References:
Geotraces. 2010. Sample and sample-handing protocols for GEOTRACES Cruises. In Standards and Intercalibration Committee [ed.]. http://www.obs-vlfr.fr/GEOTRACES/libraries/documents/Intercalibration/Cookbook.pdf.
Bishop, J.K.B., Wood, T.J., 2008. Particulate matter chemistry and dynamics in the twilight zone at VERTIGO ALOHA and K2 sites. Deep Sea Research Part I: Oceanographic Research Papers 55 (12), 1684-1706.
Calibration (tuned) voltages used:
[V_CTD_ref - V_CTD_dark] V_CTD_dark
GT11, GT-C casts: 4.686 V 0.055 V
GT10, GT-C casts: 4.646 V 0.055 V
GT11, PUMP casts: 4.852 V 0.055 V
GT10, PUMP casts: 4.8155 V 0.0556 V
GT11, st. 4 (GT-C) 4.8443 V 0.055 V*Note GT-C did not sample St. 4, these are the modified values for using the PUMP data at St. 4 in the GT-C section
For ODF casts:
Cruise Station Cast V_CTD_ref-V_CTD_dark V_CTD_dark
GT11 1 2 4.555 0.059
GT11 1 4 4.555 0.059
GT11 1 6 4.555 0.059
GT11 1 7 4.555 0.059
GT11 1 9 4.555 0.059
GT11 1 10 4.555 0.059
GT11 2 2 4.545 0.059
GT11 2 5 4.545 0.059
GT11 2 6 4.545 0.059
GT11 3 2 4.545 0.059
GT11 3 5 4.545 0.059
GT11 3 6 4.545 0.059
GT11 4 1 4.545 0.059
GT11 4 3 4.545 0.059
GT11 4 4 4.545 0.059
GT11 5 2 4.545 0.059
GT11 6 3 4.545 0.059
GT11 6 6 4.545 0.059
GT11 6 8 4.545 0.059
GT11 8 2 4.54 0.059
GT11 8 4 4.54 0.059
GT11 8 6 4.54 0.059
GT11 10 2 4.535 0.059
GT11 10 4 4.535 0.059
GT11 10 6 4.535 0.059
GT11 10 8 4.535 0.059
GT11 10 10 4.535 0.059
GT11 10 12 4.535 0.059
GT11 11 2 4.545 0.059
GT11 12 2 4.543 0.059
GT11 12 4 4.54 0.059
GT11 12 6 4.54 0.059
GT11 12 8 4.54 0.059
GT11 12 10 4.54 0.059
GT11 12 12 4.54 0.059
GT11 13 2 4.54 0.059
GT11 14 2 4.537 0.059
GT11 14 4 4.54 0.059
GT11 14 6 4.533 0.059
GT11 15 2 4.54 0.059
GT11 16 2 4.535 0.059
GT11 16 4 4.537 0.059
GT11 16 6 4.537 0.059
GT11 16 8 4.537 0.059
GT11 16 10 4.537 0.059
GT11 16 11 4.537 0.059
GT11 17 2 4.535 0.059
GT11 18 2 4.529 0.059
GT11 18 4 4.529 0.059
GT11 18 6 4.525 0.059
GT11 19 2 4.528 0.059
GT11 20 2 4.525 0.059
GT11 20 4 4.525 0.059
GT11 20 6 4.525 0.059
GT11 20 8 4.523 0.059
GT11 20 9 4.52 0.059
GT11 20 11 4.518 0.059
GT11 21 2 4.518 0.059
GT11 22 2 4.518 0.059
GT11 22 4 4.515 0.059
GT11 22 6 4.515 0.059
GT11 23 2 4.515 0.059
GT11 24 2 4.508 0.059
GT11 24 4 4.508 0.059
GT11 24 6 4.508 0.059
GT10 1 1 4.605 0.059
GT10 1 3 4.605 0.059
GT10 1 5 4.605 0.059
GT10 1 7 4.605 0.059
GT10 1 8 4.605 0.059
GT10 1 10 4.605 0.059
GT10 2 1 4.585 0.059
GT10 3 2 4.585 0.059
GT10 3 4 4.585 0.059
GT10 3 6 4.585 0.059
GT10 4 1 4.585 0.059
GT10 5 2 4.585 0.059
GT10 5 4 4.585 0.059
GT10 5 6 4.585 0.059
GT10 6 2 4.585 0.059
GT10 7 2 4.58 0.059
GT10 7 4 4.58 0.059
GT10 7 6 4.58 0.059
GT10 8 2 4.592 0.059
GT10 9 1 4.595 0.059
GT10 9 3 4.59 0.059
GT10 9 5 4.59 0.059
GT10 9 6 4.59 0.059
GT10 9 9 4.59 0.059
GT10 9 10 4.59 0.059
GT10 10 2 4.585 0.059
GT10 10 4 4.585 0.059
GT10 10 6 4.585 0.059
GT10 11 2 4.585 0.059
GT10 11 4 4.585 0.059
GT10 11 6 4.58 0.059
GT10 12 2 4.575 0.059
GT10 12 4 4.575 0.059
GT10 12 6 4.575 0.059
| File |
|---|
GT10-11_trans_Cp_ODF.csv (Comma Separated Values (.csv), 24.79 MB) MD5:00faf7762b50fe32a7ed15f80513bc52 Primary data file for dataset ID 4002 |
| Parameter | Description | Units |
| CRUISE_ID | cruise identification: GT11 = KN204; GT10 = KN199-4 | unitless |
| GEOTRC_EVENTNO | Geotraces event number | unitless |
| STNNBR | Station number within each cruise | unitless |
| CASTNO | Cast number within each station | unitless |
| LATITUDE | Station latitude; north is positive | decimal degrees |
| LONGITUDE | Station longitude; east is positive | decimal degrees |
| CTDPRS | pressure | decibars |
| CTDPRS_FLAG_W | 1 = uncalibrated reading; 2 = calibrated and no problems noted | unitless |
| CTDTMP | temperature | degrees Celsius (ITS-90) |
| CTDTMP_FLAG_W | 1 = uncalibrated reading; 2 = calibrated and no problems noted | unitless |
| CTDSAL | practical salinity | practical salinity scale (PSS-78) |
| CTDSAL_FLAG_W | 1 = uncalibrated reading; 2 = calibrated and no problems noted | unitless |
| CTDOXY | dissolved oxygen | micromole per kilogram |
| CTDOXY_FLAG_W | 1 = uncalibrated reading; 2 = calibrated and no problems noted | unitless |
| TRANSM | raw transmissometer reading | volts |
| TRANSM_FLAG | 1 = uncalibrated reading; 2 = calibrated and no problems noted | unitless |
| FLUORM | fluorometer voltage measurement | volts |
| FLUORM_FLAG | 1 = uncalibrated reading; 2 = calibrated and no problems noted | unitless |
| CTDDEPTH | depth of sample | meters |
| CTDDEPTH_FLAG | 1 = uncalibrated reading; 2 = calibrated and no problems noted | unitless |
| trans | light transmittance | unitless |
| trans_Flag | 1 = uncalibrated reading; 2 = calibrated and no problems noted | unitless |
| Cp | Particle beam attenuation coefficient | per meter |
| Cp_Flag | 1 = uncalibrated reading; 2 = calibrated and no problems noted | unitless |
| Dataset-specific Instrument Name | Wet Labs CSTAR Transmissometer |
| Generic Instrument Name | WET Labs {Sea-Bird WETLabs} C-Star transmissometer |
| Dataset-specific Description | 25 cm pathlength, 660 nm |
| Generic Instrument Description | The C-Star transmissometer has a novel monolithic housing with a highly intgrated opto-electronic design to provide a low cost, compact solution for underwater measurements of beam transmittance. The C-Star is capable of free space measurements or flow-through sampling when used with a pump and optical flow tubes. The sensor can be used in profiling, moored, or underway applications. Available with a 6000 m depth rating.
More information on Sea-Bird website: https://www.seabird.com/c-star-transmissometer/product?id=60762467717 |
KN199-04
| Website | |
| Platform | R/V Knorr |
| Report | |
| Start Date | 2010-10-15 |
| End Date | 2010-11-04 |
| Description | This cruise constitutes the first survey section as part of the U.S. participation in an international program named GEOTRACES.
Funding: NSF OCE award 0926423
Science Objectives: To obtain state of the art trace metal and isotope measurements on a suite of samples taken on a mid-latitude zonal transect of the North Atlantic. In particular, sampling targeted the oxygen minimum zone extending off the west African coast near Mauritania, the TAG hydrothermal field, and the western boundary current system along Line W. For additional information, please refer to the GEOTRACES program Web site (https://www.geotraces.org/) for overall program objectives and a summary of properties measured.
Science Activities include seawater sampling via GoFLO and Niskin carousels, in situ pumping (and filtration), CTDO2 and transmissometer sensors, underway pumped sampling of surface waters, and collection of aerosols and rain. Hydrography, CTD and nutrient measurements were supported by the Ocean Data Facility (J. Swift) at Scripps Institution of Oceanography and funded through NSF Facilities. They provided an additional CTD rosette system along with nephelometer and LADCP. A trace metal clean Go-Flo Rosette and winch were provided by the group at Old Dominion University (G. Cutter) along with a towed underway pumping system.
Additional cruise information is available from the Rolling Deck to Repository (R2R): https://www.rvdata.us/search/cruise/KN199-04
Other Relevant Links:
List of cruise participants: [ PDF ]
Cruise track: JPEG image (from Woods Hole Oceanographic Institution, vessel operator)
ADCP data are available from the Currents ADCP group at the University of Hawaii: KN199-04 ADCP |
KN204-01
| Website | |
| Platform | R/V Knorr |
| Report | |
| Start Date | 2011-11-06 |
| End Date | 2011-12-11 |
| Description | The US GEOTRACES North Atlantic cruise aboard the R/V Knorr completed the section between Lisbon and Woods Hole that began in October 2010 but was rescheduled for November-December 2011. The R/V Knorr made a brief stop in Bermuda to exchange samples and personnel before continuing across the basin. Scientists disembarked in Praia, Cape Verde, on 11 December. The cruise was identified as KN204-01A (first part before Bermuda) and KN204-01B (after the Bermuda stop). However, the official deployment name for this cruise is KN204-01 and includes both part A and B.
Science activities included: ODF 30 liter rosette CTD casts, ODU Trace metal rosette CTD casts, McLane particulate pump casts, underway sampling with towed fish and sampling from the shipboard "uncontaminated" flow-through system.
Full depth stations are shown in the accompanying figure (see below). Additional stations to sample for selected trace metals to a depth of 1000 m are not shown. Standard stations are shown in red (as are the ports) and "super" stations, with extra casts to provide large-volume samples for selected parameters, are shown in green.
Station spacing is concentrated along the western margin to evaluate the transport of trace elements and isotopes by western boundary currents. Stations across the gyre will allow scientists to examine trace element supply by Saharan dust, while also contrasting trace element and isotope distributions in the oligotrophic gyre with conditions near biologically productive ocean margins, both in the west, to be sampled now, and within the eastern boundary upwelling system off Mauritania, sampled last year.
Funding: The cruise was funded by NSF OCE awards 0926204, 0926433 and 0926659.
Additional cruise information is available from the Rolling Deck to Repository (R2R): https://www.rvdata.us/search/cruise/KN204-01
Other Relevant Links:
ADCP data are available from the Currents ADCP group at the University of Hawaii at the links below:
KN204-01A (part 1 of 2011 cruise; Woods Hole, MA to Bermuda)
KN204-01B (part 2 of 2011 cruise; Bermuda to Cape Verde) |
U.S. GEOTRACES North Atlantic Transect (GA03) (U.S. GEOTRACES NAT)
Much of this text appeared in an article published in OCB News, October 2008, by the OCB Project Office.
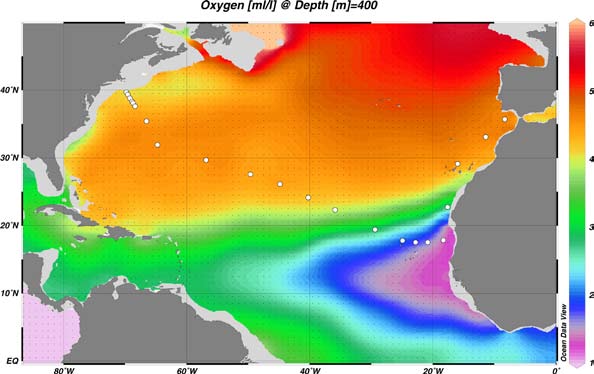
The first U.S. GEOTRACES Atlantic Section will be specifically centered around a sampling cruise to be carried out in the North Atlantic in 2010. Ed Boyle (MIT) and Bill Jenkins (WHOI) organized a three-day planning workshop that was held September 22-24, 2008 at the Woods Hole Oceanographic Institution. The main goal of the workshop, sponsored by the National Science Foundation and the U.S. GEOTRACES Scientific Steering Committee, was to design the implementation plan for the first U.S. GEOTRACES Atlantic Section. The primary cruise design motivation was to improve knowledge of the sources, sinks and internal cycling of Trace Elements and their Isotopes (TEIs) by studying their distributions along a section in the North Atlantic (Figure 1). The North Atlantic has the full suite of processes that affect TEIs, including strong meridional advection, boundary scavenging and source effects, aeolian deposition, and the salty Mediterranean Outflow. The North Atlantic is particularly important as it lies at the "origin" of the global Meridional Overturning Circulation.
It is well understood that many trace metals play important roles in biogeochemical processes and the carbon cycle, yet very little is known about their large-scale distributions and the regional scale processes that affect them. Recent advances in sampling and analytical techniques, along with advances in our understanding of their roles in enzymatic and catalytic processes in the open ocean provide a natural opportunity to make substantial advances in our understanding of these important elements. Moreover, we are motivated by the prospect of global change and the need to understand the present and future workings of the ocean's biogeochemistry. The GEOTRACES strategy is to measure a broad suite of TEIs to constrain the critical biogeochemical processes that influence their distributions. In addition to these "exotic" substances, more traditional properties, including macronutrients (at micromolar and nanomolar levels), CTD, bio-optical parameters, and carbon system characteristics will be measured. The cruise starts at Line W, a repeat hydrographic section southeast of Cape Cod, extends to Bermuda and subsequently through the North Atlantic oligotrophic subtropical gyre, then transects into the African coast in the northern limb of the coastal upwelling region. From there, the cruise goes northward into the Mediterranean outflow. The station locations shown on the map are for the "fulldepth TEI" stations, and constitute approximately half of the stations to be ultimately occupied.
Figure 1. The proposed 2010 Atlantic GEOTRACES cruise track plotted on dissolved oxygen at 400 m depth. Data from the World Ocean Atlas (Levitus et al., 2005) were plotted using Ocean Data View (courtesy Reiner Schlitzer). [click on the image to view a larger version]
Hydrography, CTD and nutrient measurements will be supported by the Ocean Data Facility (J. Swift) at Scripps Institution of Oceanography and funded through NSF Facilities. They will be providing an additional CTD rosette system along with nephelometer and LADCP. A trace metal clean Go-Flo Rosette and winch will be provided by the group at Old Dominion University (G. Cutter) along with a towed underway pumping system.
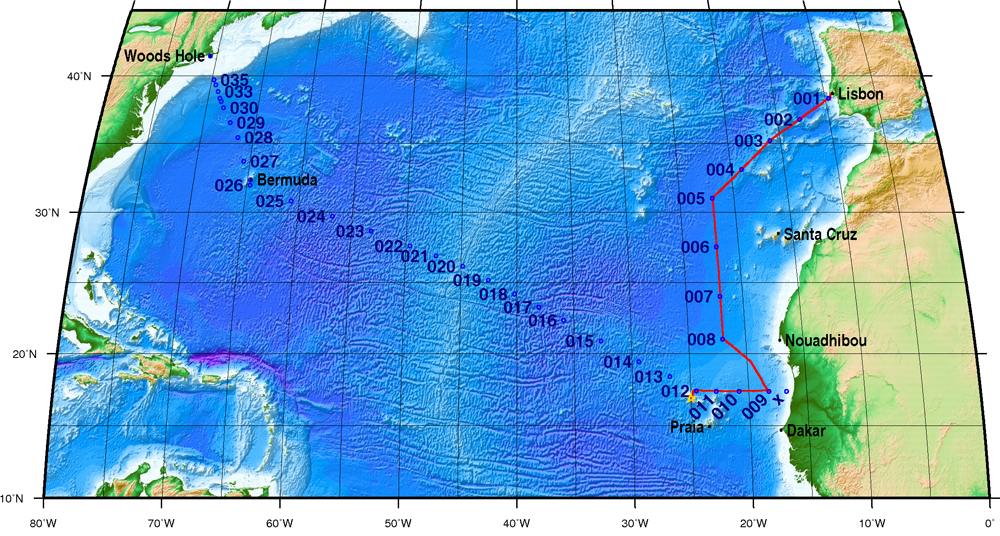
The North Atlantic Transect cruise began in 2010 with KN199 leg 4 (station sampling) and leg 5 (underway sampling only) (Figure 2).
Figure 2. The red line shows the cruise track for the first leg of the US Geotraces North Atlantic Transect on the R/V Knorr in October 2010. The rest of the stations (beginning with 13) will be completed in October-December 2011 on the R/V Knorr (courtesy of Bill Jenkins, Chief Scientist, GNAT first leg). [click on the image to view a larger version]
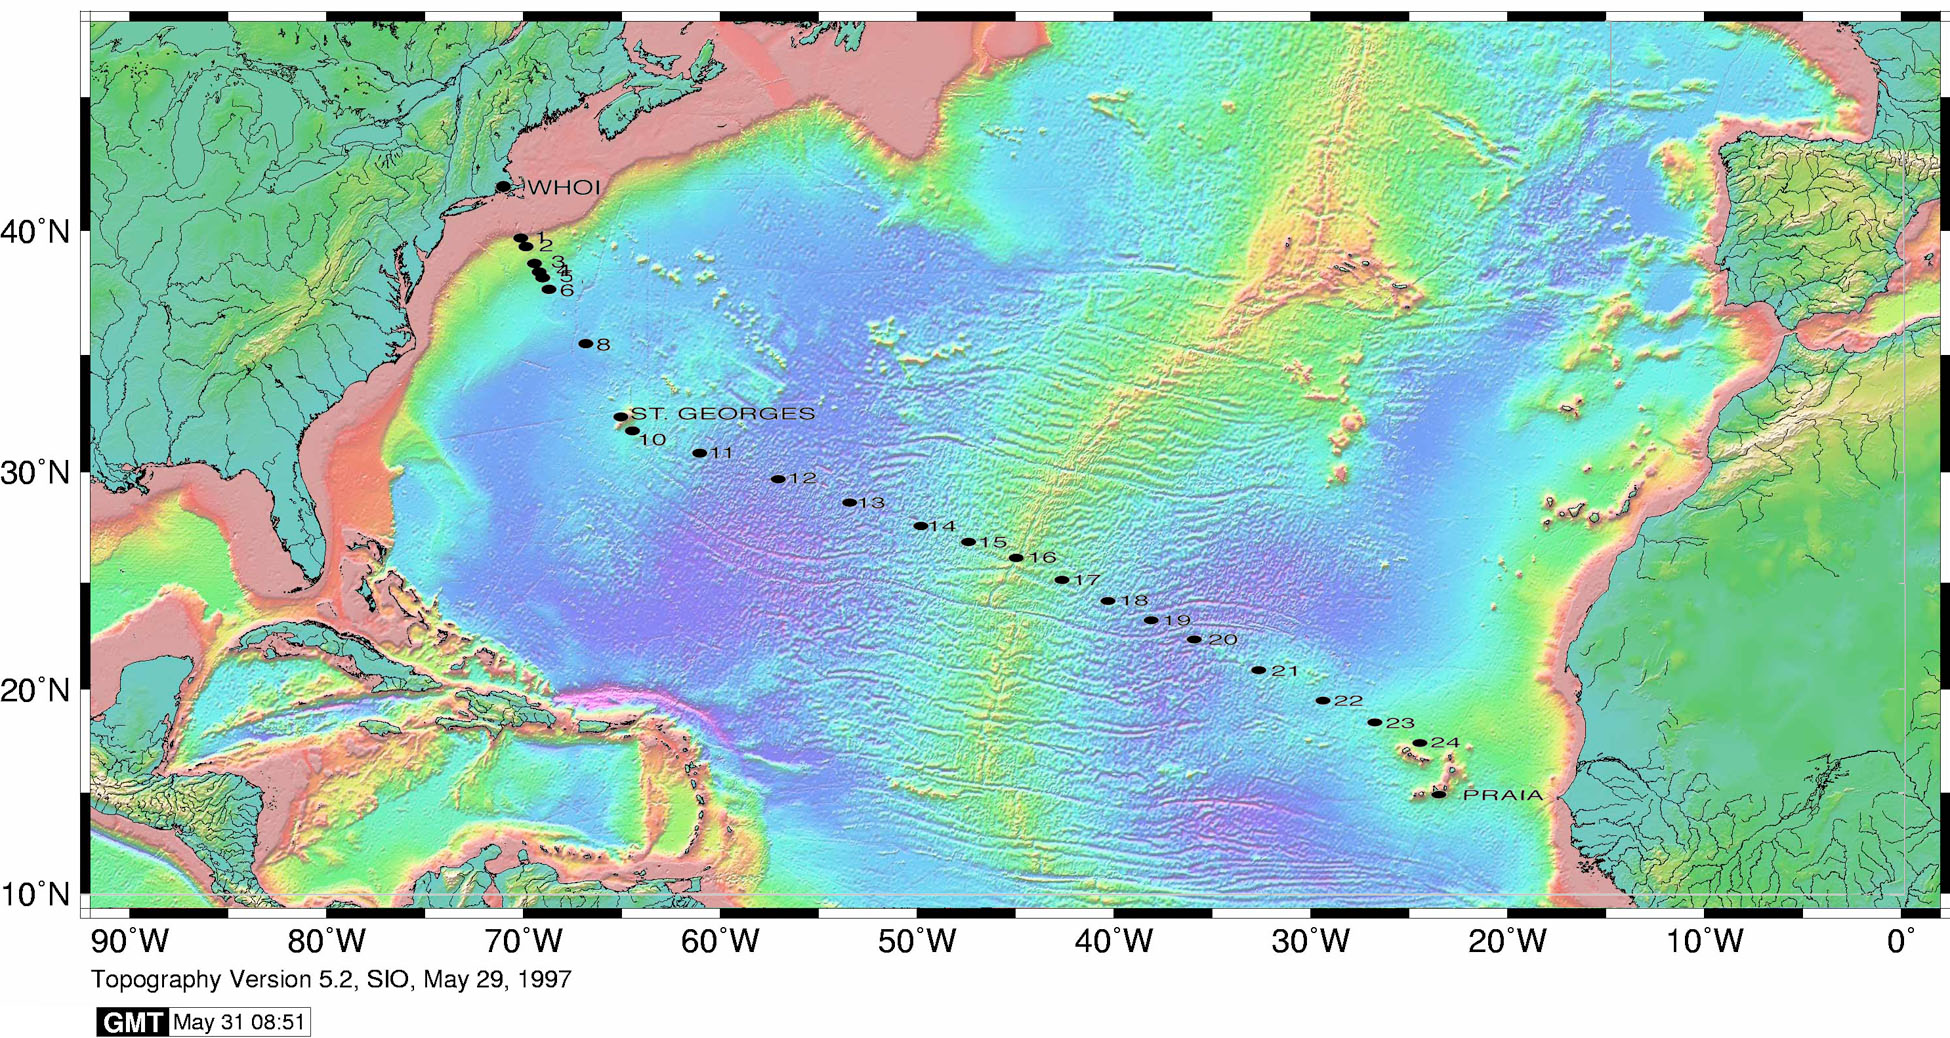
The section completion effort resumed again in November 2011 with KN204-01A,B (Figure 3).
KN204-01A,B Cruise Report (PDF)
Figure 3. Station locations occupied on the US Geotraces North Atlantic Transect on the R/V Knorr in November 2011. [click on the image to view a larger version]
Data from the North Atlantic Transect cruises are available under the Datasets heading below, and consensus values for the SAFe and North Atlantic GEOTRACES Reference Seawater Samples are available from the GEOTRACES Program Office: Standards and Reference Materials
ADCP data are available from the Currents ADCP group at the University of Hawaii at the links below:
KN199-04 (leg 1 of 2010 cruise; Lisbon to Cape Verde)
KN199-05 (leg 2 of 2010 cruise; Cape Verde to Charleston, NC)
KN204-01A (part 1 of 2011 cruise; Woods Hole, MA to Bermuda)
KN204-01B (part 2 of 2011 cruise; Bermuda to Cape Verde)
U.S. GEOTRACES (U.S. GEOTRACES)
GEOTRACES is a SCOR sponsored program; and funding for program infrastructure development is provided by the U.S. National Science Foundation.
GEOTRACES gained momentum following a special symposium, S02: Biogeochemical cycling of trace elements and isotopes in the ocean and applications to constrain contemporary marine processes (GEOSECS II), at a 2003 Goldschmidt meeting convened in Japan. The GEOSECS II acronym referred to the Geochemical Ocean Section Studies To determine full water column distributions of selected trace elements and isotopes, including their concentration, chemical speciation, and physical form, along a sufficient number of sections in each ocean basin to establish the principal relationships between these distributions and with more traditional hydrographic parameters;
* To evaluate the sources, sinks, and internal cycling of these species and thereby characterize more completely the physical, chemical and biological processes regulating their distributions, and the sensitivity of these processes to global change; and
* To understand the processes that control the concentrations of geochemical species used for proxies of the past environment, both in the water column and in the substrates that reflect the water column.
GEOTRACES will be global in scope, consisting of ocean sections complemented by regional process studies. Sections and process studies will combine fieldwork, laboratory experiments and modelling. Beyond realizing the scientific objectives identified above, a natural outcome of this work will be to build a community of marine scientists who understand the processes regulating trace element cycles sufficiently well to exploit this knowledge reliably in future interdisciplinary studies.
Expand "Projects" below for information about and data resulting from individual US GEOTRACES research projects.
| Funding Source | Award |
|---|---|
| NSF Division of Ocean Sciences (NSF OCE) |
[ table of contents | back to top ]