Depth profiles of seawater d18O and dD from R/V Knorr KN199-04 in the subtropical N. Atlantic Ocean from Oct. 2010 (U.S. GEOTRACES NAT project, GEOTRACES: Intercal Phosphate Oxygen project)
Project
Program
| Contributors | Affiliation | Role |
|---|---|---|
| Voelker, Antje H.L. | Instituto Portugues do Mar e da Atmosfera (IPMA) | Principal Investigator |
| Colman, Albert | University of Chicago | Co-Principal Investigator |
| Copley, Nancy | Woods Hole Oceanographic Institution (WHOI BCO-DMO) | BCO-DMO Data Manager |
This data are published in: Voelker, A.H.L., Colman, A., Olack, G., Waniek, J.J. and Hodell, D., 2015. Oxygen and hydrogen isotope signatures of Northeast Atlantic water masses. Deep Sea Research Part II: Topical Studies in Oceanography, doi: http://dx.doi.org/10.1016/j.dsr2.2014.11.006.
Data for KN204-01 (GT11) not yet submitted. (9 June 2014)
Methods for Godwin Lab/ A. Voelker data:
Water oxygen and hydrogen isotopes were measured simultaneously by cavity ringdown laser spectroscopy (CRDS) using a L1102-i Picarro water isotope analyzer and A0211 high-precision vaporizer. Each sample was injected nine times into the vaporizer. Memory effects from previous samples were avoided by rejecting the first three analyses. Values for the final six injections were averaged with in-run precision of less than ±0.1 for d18O and ±1 for dD (1-standard deviation). Calibration of results to V-SMOW was achieved by analyzing internal standards before and after each set of 7 or 8 samples. Internal standards were calibrated against V-SMOW, GISP, and SLAP. All results are reported in parts per thousand (o/oo) relative to V-SMOW.
The instrument was calibrated at the start of each run using three working standards from the University of Cambridge (Delta, Botty, Spit) with known values calibrated against V-SMOW, GISP, and SLAP. An internal seawater standard (SPIT) was analysed after every three samples to correct for instrument drift.
Methods for d18O and dD analysis at the University of Chicago
All seawater samples were processed on a GasBench II (Thermo, Bremen, Germany) with a CTC GC Pal (CTC analytics) and interfaced to a Delta V Plus isotope ratio mass spectrometer (Thermo). A hydrogen equilibration method using Pt catalyst was used for dD analysis; a classical CO2-H2O equilibration was used for d18O analysis. In both cases, samples were entrained in a helium carrier gas with gas sample cleanup and removal of water vapor achieved on the GasBench II peripheral prior to isotopic analysis in continuous flow mode on the mass spectrometer.
For D/H analyses, Pt catalyst sticks (Thermo P/N 1091831) were loaded into Exetainer tubes (Labco, 12 mL, screw cap with butyl rubber septa inserts). Water (samples and standards) were added to each tube using fresh 1 mL syringes (BD syringe) and needles (20 or 22 Ga, 1 or 1.5 inch lengths, BD precision Glide), with 300 µL of seawater sample used for all D/H runs. Standards were either primary (VSMOW2, SLAP2, and/or GISP from the IAEA) or house standards calibrated to the primary standards. The exetainers with Pt catalyst and water were loaded into the GasBench II heater block at 26°C in a group of 5 rows of 10 tubes. The CTC GC PAL sampling and flushing needles were side by side and spaced by 5 positions in the heater block. The first set of 5 tubes were flushed (2% H2 in He (Airgas), 20 mL/min), then following a pause, sampling of the first set of tubes was completed coincident with flushing of the adjacent set of tubes. Total incubation time of H2 gas mix with water and Pt catalyst was 68 minutes for each tube (end of flushing to start of analysis). The dD analysis on headspace H2 takes 15 min: 60 sec transfer time, 3 reference gas pulses (20 sec each, 30 and 80 sec spacing, last used as the reference peak) and 8 sample pulses (100 µL sampling loop, 45 sec load time at 0.5 mL/min, 35 second injection time at 1 mL/min, through PoraPlot Q GC column, 25m x 0.32mm, Varian, at 50°C). Typically the middle six sample peaks are used for isotopic composition determination, and linear plot of the peak’s result vs. peak number determined and the value for the first peak in the series is calculated from the slope and intercept.
For d18O runs, capped Exetainer tubes were flushed with 0.3% CO2 in He (Airgas, ca. 20 mL/min) using the PAL autosampler. Then 200 to 300 microliters of seawater or standard was injected into the Exetainer tube as described for the D/H sample injection. The tubes were incubated in the Gasbench II heater block at 26°C for 24 hrs before the analysis was initiated. The CTC GC PAL sampling parameters, GasBench II injection loop program and pattern of reference and sample peaks, and peak processing was similar to that described for dD measurements.
Raw d18O analyses are corrected for the fractionation factor between water and CO2 as a function of temperature of equilibration, mass balance between water oxygen and CO2 oxygen present in the tube, and to the isotopic reference materials using standard practices (Friedman and O’Neil). The D/H analyses are corrected to the standards (Nelson, 2000), and then a uniform -2.0 o/oo salt correction (Martineau et al., 2012) is applied to compensate for isotopic enrichment of the headspace H2 for the seawater samples. Both oxygen and hydrogen isotope compositions are reported on the VSMOW scale
Averages were calculated for duplicate measurements.
| File |
|---|
isotopes_OH.csv (Comma Separated Values (.csv), 29.85 KB) MD5:d779e77036aae6a4876c76b837289ba9 Primary data file for dataset ID 472814 |
| Parameter | Description | Units |
| cruise_id | Cruise ID number | dimensionless |
| station_GEOTRC | Station number within cruise | dimensionless |
| lat_sta | Nominal latitude of station. Obtained from KN199-04 station waypoints provided by Chief Sci. | degrees North |
| lon_sta | Nominal longitude of station. Obtained from KN199-04 station waypoints provided by Chief Sci. | degrees East |
| depth_GEOTRC_CTD | Observation/sample depth in meters. Calculated from CTD pressure. | meters |
| cast_GEOTRC | Cast identifier; numbered consecutively within a station. | dimensionless |
| event_GEOTRC | Unique identifying number for US GEOTRACES sampling events; ranges from 2001 to 2225 for KN199-04 events and from 3001 to 3282 for KN204-01 events. | dimensionless |
| date | Date sample collected; UTC | YYYYMMDD |
| time | Time sample collected; UTC | hhmm (h = hour; m = minute) |
| bottle_GEOTRC | Alphanumeric characters identifying bottle type (e.g. NIS representing Niskin and GF representing GOFLO) and position on a CTD rosette. | dimensionless |
| sample_bottle_GEOTRC | Unique identification numbers given to samples taken from bottles; rangies from 1 to 24; often used synonymously with bottle number. | dimensionless |
| sample_GEOTRC | Unique identifying number for US GEOTRACES samples; ranges from 5033 to 6078 for KN199-04 and from 6112 to 8148 for KN204-01. | dimensionless |
| sample | Internal Lab sample ID given by A. Colman | dimensionless |
| laboratory | Laboratory responsible for analysis: 1 = Godwin; 2 = Chicago | dimensionless |
| d18O_1 | Isotope ratio 18O/16O; 1st analysis | permil V-SMOW |
| d18O_stdev_1_Chicago | 1 sigma standard deviation for the samples analysed by the Chicago lab (Colman): 1st analysis. | permil V-SMOW |
| d18O_QF_1 | Quality flag of results from 1st analysis: 1= ok; 2 = unusual but accepted; 9 = rejected | dimensionless |
| d18O_2 | Isotope ratio 18O/16O; 2nd analysis | permil V-SMOW |
| d18O_stdev_2_Chicago | 1 sigma standard deviation for the samples analysed by the Chicago lab (Colman): 2nd analysis. | permil V-SMOW |
| d18O_QF_2 | Quality flag of results from 2nd analysis: 1= ok; 2 = unusual but accepted; 9 = rejected | dimensionless |
| d18O_mean | Average of d18O analyses | permil V-SMOW |
| d18O_stdev_mean | 1 sigma standard deviation | permil V-SMOW |
| dD_1 | Isotope ratio of 2H:1H; 1st analysis | permil V-SMOW |
| dD_corr_Chicago | Chicago value corrected by -2 o/oo | permil V-SMOW |
| dD_stdev_Chicago | 1 sigma standard deviation Chicago | permil V-SMOW |
| dD_QF_1 | Quality flag of results from 1st analysis: 1= ok; 2 = unusual but accepted; 9 = rejected | dimensionless |
| dD_2 | Isotope ratio of 2H:1H; 2nd analysis | permil V-SMOW |
| dD_QF_2 | Quality flag of results from 2nd analysis: 1= ok; 2 = unusual but accepted; 9 = rejected | dimensionless |
| dD_mean | Average of dD analyses | permil V-SMOW |
| dD_stdev_mean | dD; 1 sigma standard deviation | permil V-SMOW |
| cruise_part | name given to a leg of the cruise | unitless |
| Dataset-specific Instrument Name | Gas Chromatograph |
| Generic Instrument Name | Gas Chromatograph |
| Dataset-specific Description | PoraPlot Q GC column, 25m x 0.32mm, Varian, at 50C). |
| Generic Instrument Description | Instrument separating gases, volatile substances, or substances dissolved in a volatile solvent by transporting an inert gas through a column packed with a sorbent to a detector for assay. (from SeaDataNet, BODC) |
| Dataset-specific Instrument Name | GO-FLO |
| Generic Instrument Name | GO-FLO Bottle |
| Dataset-specific Description | Demi station samples were collected from the GEOTRACES GO-FLO rosette. The U.S. GEOTRACES sampling system consisted of 24 Teflon-coated GO-FLO bottles. |
| Generic Instrument Description | GO-FLO bottle cast used to collect water samples for pigment, nutrient, plankton, etc. The GO-FLO sampling bottle is specially designed to avoid sample contamination at the surface, internal spring contamination, loss of sample on deck (internal seals), and exchange of water from different depths. |
| Dataset-specific Instrument Name | IR Mass Spec |
| Generic Instrument Name | Isotope-ratio Mass Spectrometer |
| Dataset-specific Description | Colman Lab: All seawater samples were processed on a GasBench II (Thermo, Bremen, Germany) with a CTC GC Pal (CTC analytics) and interfaced to a Delta V Plus isotope ratio mass spectrometer (Thermo) |
| Generic Instrument Description | The Isotope-ratio Mass Spectrometer is a particular type of mass spectrometer used to measure the relative abundance of isotopes in a given sample (e.g. VG Prism II Isotope Ratio Mass-Spectrometer). |
| Dataset-specific Instrument Name | Niskin bottle |
| Generic Instrument Name | Niskin bottle |
| Generic Instrument Description | A Niskin bottle (a next generation water sampler based on the Nansen bottle) is a cylindrical, non-metallic water collection device with stoppers at both ends. The bottles can be attached individually on a hydrowire or deployed in 12, 24, or 36 bottle Rosette systems mounted on a frame and combined with a CTD. Niskin bottles are used to collect discrete water samples for a range of measurements including pigments, nutrients, plankton, etc. |
| Dataset-specific Instrument Name | Spectrometer |
| Generic Instrument Name | Spectrometer |
| Dataset-specific Description | Godwin/Voelker Lab: Water oxygen and hydrogen isotopes were measured simultaneously by cavity ringdown laser spectroscopy (CRDS) using a L1102-i Picarro water isotope analyzer and A0211 high-precision vaporizer. |
| Generic Instrument Description | A spectrometer is an optical instrument used to measure properties of light over a specific portion of the electromagnetic spectrum. |
KN199-04
| Website | |
| Platform | R/V Knorr |
| Report | |
| Start Date | 2010-10-15 |
| End Date | 2010-11-04 |
| Description | This cruise constitutes the first survey section as part of the U.S. participation in an international program named GEOTRACES.
Funding: NSF OCE award 0926423
Science Objectives: To obtain state of the art trace metal and isotope measurements on a suite of samples taken on a mid-latitude zonal transect of the North Atlantic. In particular, sampling targeted the oxygen minimum zone extending off the west African coast near Mauritania, the TAG hydrothermal field, and the western boundary current system along Line W. For additional information, please refer to the GEOTRACES program Web site (https://www.geotraces.org/) for overall program objectives and a summary of properties measured.
Science Activities include seawater sampling via GoFLO and Niskin carousels, in situ pumping (and filtration), CTDO2 and transmissometer sensors, underway pumped sampling of surface waters, and collection of aerosols and rain. Hydrography, CTD and nutrient measurements were supported by the Ocean Data Facility (J. Swift) at Scripps Institution of Oceanography and funded through NSF Facilities. They provided an additional CTD rosette system along with nephelometer and LADCP. A trace metal clean Go-Flo Rosette and winch were provided by the group at Old Dominion University (G. Cutter) along with a towed underway pumping system.
Additional cruise information is available from the Rolling Deck to Repository (R2R): https://www.rvdata.us/search/cruise/KN199-04
Other Relevant Links:
List of cruise participants: [ PDF ]
Cruise track: JPEG image (from Woods Hole Oceanographic Institution, vessel operator)
ADCP data are available from the Currents ADCP group at the University of Hawaii: KN199-04 ADCP |
U.S. GEOTRACES North Atlantic Transect (GA03) (U.S. GEOTRACES NAT)
Much of this text appeared in an article published in OCB News, October 2008, by the OCB Project Office.
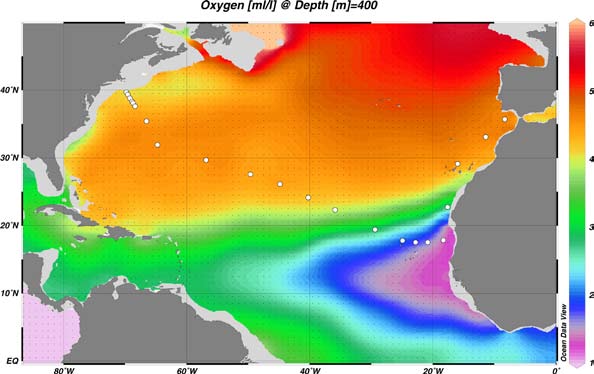
The first U.S. GEOTRACES Atlantic Section will be specifically centered around a sampling cruise to be carried out in the North Atlantic in 2010. Ed Boyle (MIT) and Bill Jenkins (WHOI) organized a three-day planning workshop that was held September 22-24, 2008 at the Woods Hole Oceanographic Institution. The main goal of the workshop, sponsored by the National Science Foundation and the U.S. GEOTRACES Scientific Steering Committee, was to design the implementation plan for the first U.S. GEOTRACES Atlantic Section. The primary cruise design motivation was to improve knowledge of the sources, sinks and internal cycling of Trace Elements and their Isotopes (TEIs) by studying their distributions along a section in the North Atlantic (Figure 1). The North Atlantic has the full suite of processes that affect TEIs, including strong meridional advection, boundary scavenging and source effects, aeolian deposition, and the salty Mediterranean Outflow. The North Atlantic is particularly important as it lies at the "origin" of the global Meridional Overturning Circulation.
It is well understood that many trace metals play important roles in biogeochemical processes and the carbon cycle, yet very little is known about their large-scale distributions and the regional scale processes that affect them. Recent advances in sampling and analytical techniques, along with advances in our understanding of their roles in enzymatic and catalytic processes in the open ocean provide a natural opportunity to make substantial advances in our understanding of these important elements. Moreover, we are motivated by the prospect of global change and the need to understand the present and future workings of the ocean's biogeochemistry. The GEOTRACES strategy is to measure a broad suite of TEIs to constrain the critical biogeochemical processes that influence their distributions. In addition to these "exotic" substances, more traditional properties, including macronutrients (at micromolar and nanomolar levels), CTD, bio-optical parameters, and carbon system characteristics will be measured. The cruise starts at Line W, a repeat hydrographic section southeast of Cape Cod, extends to Bermuda and subsequently through the North Atlantic oligotrophic subtropical gyre, then transects into the African coast in the northern limb of the coastal upwelling region. From there, the cruise goes northward into the Mediterranean outflow. The station locations shown on the map are for the "fulldepth TEI" stations, and constitute approximately half of the stations to be ultimately occupied.
Figure 1. The proposed 2010 Atlantic GEOTRACES cruise track plotted on dissolved oxygen at 400 m depth. Data from the World Ocean Atlas (Levitus et al., 2005) were plotted using Ocean Data View (courtesy Reiner Schlitzer). [click on the image to view a larger version]
Hydrography, CTD and nutrient measurements will be supported by the Ocean Data Facility (J. Swift) at Scripps Institution of Oceanography and funded through NSF Facilities. They will be providing an additional CTD rosette system along with nephelometer and LADCP. A trace metal clean Go-Flo Rosette and winch will be provided by the group at Old Dominion University (G. Cutter) along with a towed underway pumping system.
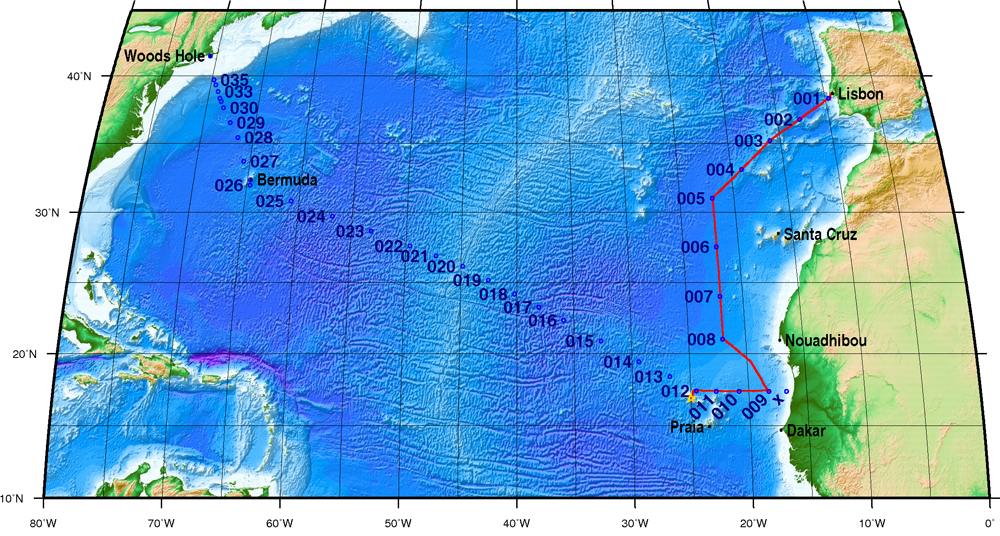
The North Atlantic Transect cruise began in 2010 with KN199 leg 4 (station sampling) and leg 5 (underway sampling only) (Figure 2).
Figure 2. The red line shows the cruise track for the first leg of the US Geotraces North Atlantic Transect on the R/V Knorr in October 2010. The rest of the stations (beginning with 13) will be completed in October-December 2011 on the R/V Knorr (courtesy of Bill Jenkins, Chief Scientist, GNAT first leg). [click on the image to view a larger version]
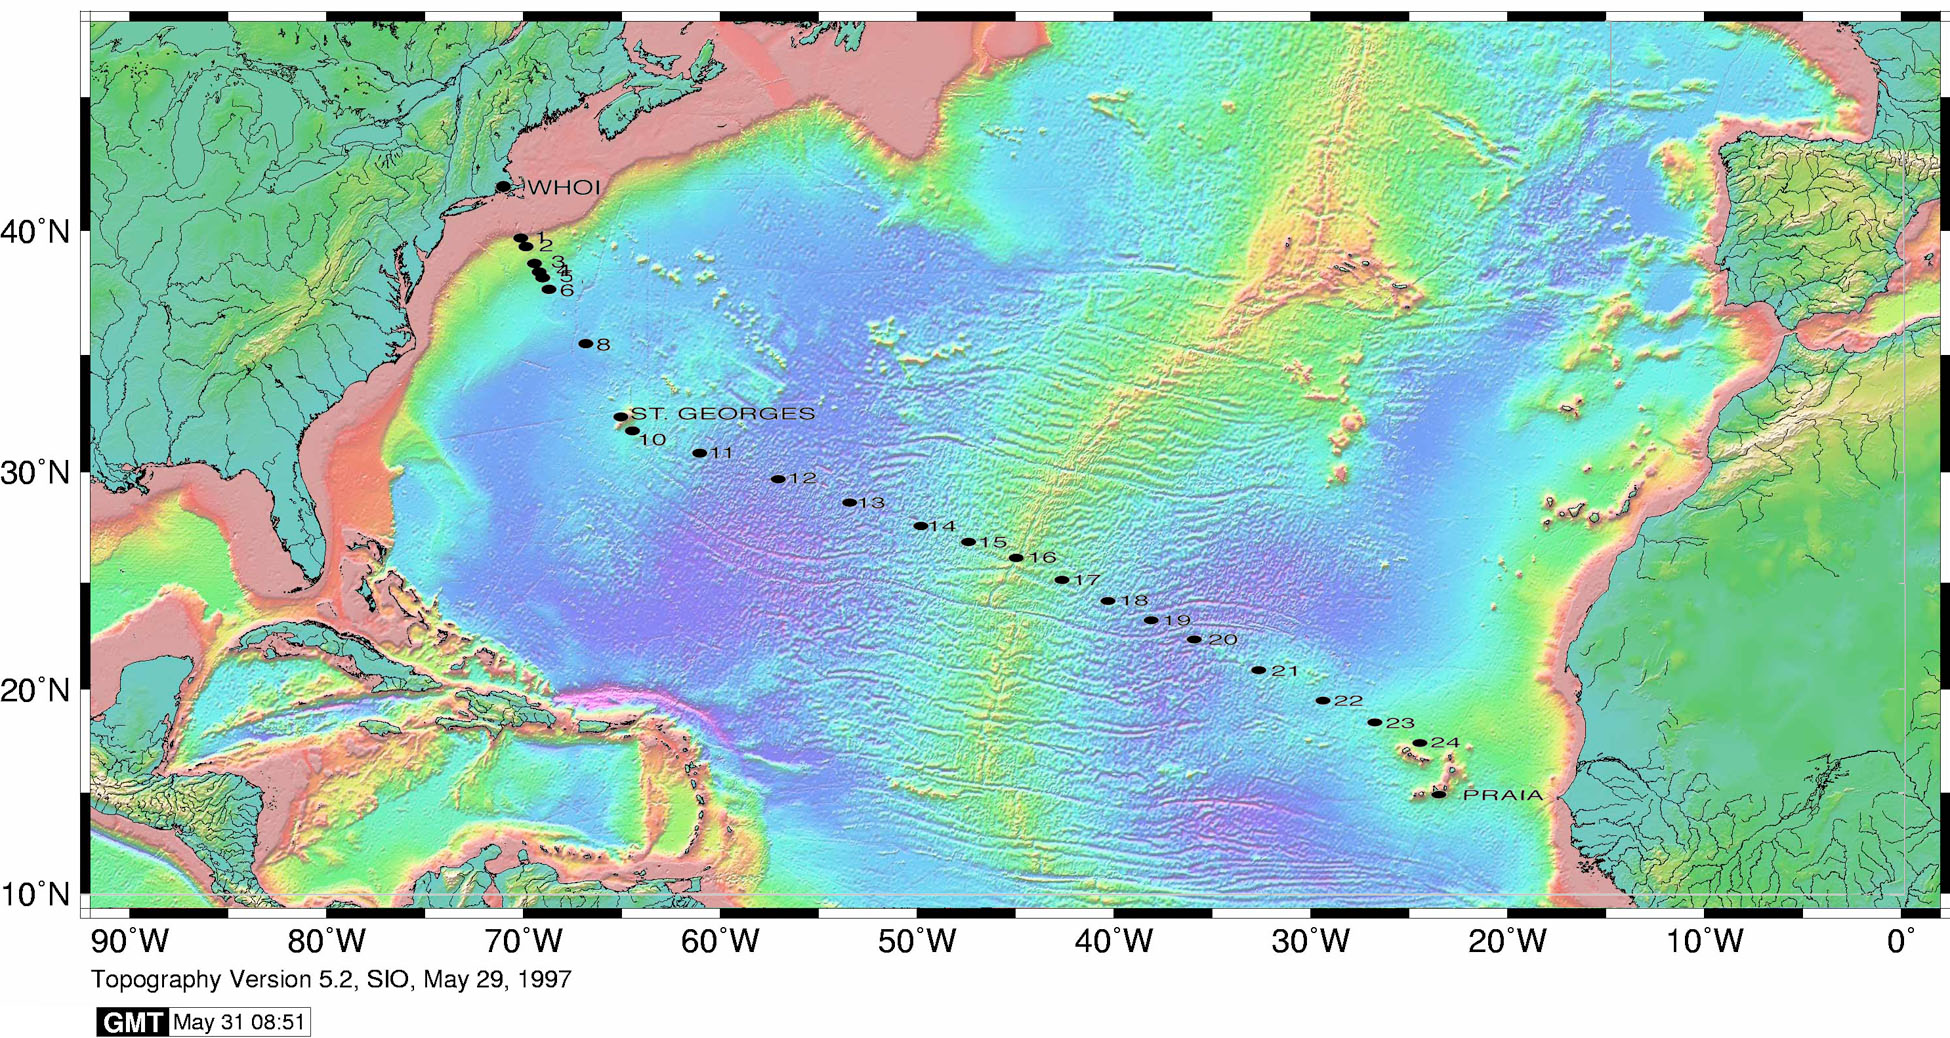
The section completion effort resumed again in November 2011 with KN204-01A,B (Figure 3).
KN204-01A,B Cruise Report (PDF)
Figure 3. Station locations occupied on the US Geotraces North Atlantic Transect on the R/V Knorr in November 2011. [click on the image to view a larger version]
Data from the North Atlantic Transect cruises are available under the Datasets heading below, and consensus values for the SAFe and North Atlantic GEOTRACES Reference Seawater Samples are available from the GEOTRACES Program Office: Standards and Reference Materials
ADCP data are available from the Currents ADCP group at the University of Hawaii at the links below:
KN199-04 (leg 1 of 2010 cruise; Lisbon to Cape Verde)
KN199-05 (leg 2 of 2010 cruise; Cape Verde to Charleston, NC)
KN204-01A (part 1 of 2011 cruise; Woods Hole, MA to Bermuda)
KN204-01B (part 2 of 2011 cruise; Bermuda to Cape Verde)
GEOTRACES: Intercalibration of Phosphate Oxygen Isotope Analyses and Sample Processing Techniques (GEOTRACES: Intercal Phosphate Oxygen)
Abstract:
The oxygen isotope composition of dissolved phosphate has the utility of tracing sources of this nutrient in continental shelf and upper slope environments, yield insights into remineralization mechanisms in the open ocean, and reveal biological turnover rates of phosphate. However, currently only a few published measurements are available. Inclusion of this parameter into the GEOTRACES Program would significantly enhance the data set but requires that his component be intercalibrated. For this reason, a scientist from the University of Chicago plans to collect and analyze water samples for the oxygen isotope composition of dissolved phosphate during the GEOTRACES intercalibration cruises to the Atlantic and Pacific Ocean. Once the analyses are completed, a set of recommendations on the best practices to obtain reliable measurements would be made accessible to the ocean sciences community. In addition, the researcher proposes to distribute samples and standards for the analysis of oxygen isotope composition of dissolved phosphate.
As regards broader impacts, this intercalibration effort could represent a first step towards the development of a new tracer for the ocean sciences community aimed at furthering our understanding of the phosphorus cycle.
U.S. GEOTRACES (U.S. GEOTRACES)
GEOTRACES is a SCOR sponsored program; and funding for program infrastructure development is provided by the U.S. National Science Foundation.
GEOTRACES gained momentum following a special symposium, S02: Biogeochemical cycling of trace elements and isotopes in the ocean and applications to constrain contemporary marine processes (GEOSECS II), at a 2003 Goldschmidt meeting convened in Japan. The GEOSECS II acronym referred to the Geochemical Ocean Section Studies To determine full water column distributions of selected trace elements and isotopes, including their concentration, chemical speciation, and physical form, along a sufficient number of sections in each ocean basin to establish the principal relationships between these distributions and with more traditional hydrographic parameters;
* To evaluate the sources, sinks, and internal cycling of these species and thereby characterize more completely the physical, chemical and biological processes regulating their distributions, and the sensitivity of these processes to global change; and
* To understand the processes that control the concentrations of geochemical species used for proxies of the past environment, both in the water column and in the substrates that reflect the water column.
GEOTRACES will be global in scope, consisting of ocean sections complemented by regional process studies. Sections and process studies will combine fieldwork, laboratory experiments and modelling. Beyond realizing the scientific objectives identified above, a natural outcome of this work will be to build a community of marine scientists who understand the processes regulating trace element cycles sufficiently well to exploit this knowledge reliably in future interdisciplinary studies.
Expand "Projects" below for information about and data resulting from individual US GEOTRACES research projects.
| Funding Source | Award |
|---|---|
| NSF Division of Ocean Sciences (NSF OCE) | |
| Centro de Investigacao Marinha e Ambiental (CIMAR) |
[ table of contents | back to top ]