GeoFish nutrients and salts along the US GEOTRACES East Pacific Zonal Transect from the R/V Thomas G. Thompson TN303 cruise in the tropical Pacific from Peru to Tahiti during 2013 (U.S. GEOTRACES EPZT project)
Project
Program
| Contributors | Affiliation | Role |
|---|---|---|
| Moffett, James W. | University of Southern California (USC-HIMS) | Lead Principal Investigator, Contact |
| Cutter, Gregory A. | Old Dominion University (ODU) | Co-Principal Investigator |
| German, Christopher R. | Woods Hole Oceanographic Institution (WHOI) | Co-Principal Investigator |
| Gegg, Stephen R. | Woods Hole Oceanographic Institution (WHOI BCO-DMO) | BCO-DMO Data Manager |
Abstract
Surface FISH Nutrients and Salinities (for each station). Nutrient values are reported in umol/L units; Salinity is PSS-78.
Methodology (extracted from the TN303 cruise report):
Salinity and nutrient samples were taken from the surface fish and from Niskins attached to the wire at each Deep and Mid McLane pump cast.
Nutrient analyses (phosphate, silicate, nitrate+nitrite, nitrite) were performed on a Seal Analytical continuous-flow AutoAnalyzer 3 (AA3). The analytical methods used are described by Gordon et al., Hager et al., and Atlas et al.
Silicate: Silicate was analyzed using the technique of Kirkwood et al. An acidic solution of ammonium molybdate was added to a seawater sample to produce silicomolybdic acid, which was then reduced to a silicomolybdenum blue complex following the addition of ascorbic acid. Oxalic acid was also added to impede PO4 color development. The sample was passed through a flowcell and the absorbance measured at 660nm.
Nitrate + Nitrite: A modification of Armstrong et al. procedure was used for the analysis of nitrate and nitrite. For the nitrate analysis, the seawater sample was passed through a cadmium reduction column where nitrate was quantitatively reduced to nitrite. Sulfanilamide was introduced to the sample stream followed by N-(1-naphthyl)ethylenediamine dihydrochloride which coupled to form a red azo dye. The stream was then passed through a flowcell and the absorbance measured at 520nm. The same technique was employed for nitrite analysis, except the cadmium column was not present.
Phosphate: Phosphate was analyzed using the Murphy and Riley technique. An acidic solution of ammonium molybdate and antimony potassium tartrate was added to the sample to produce phosphomolybdic acid, then reduced to phosphomolybdous acid (a blue compound) following the addition of ascorbic acid. The reaction product was heated to ~37 degrees C to enhance color development, then passed through a flowcell and the absorbance measured at 880nm.
Salinity: A single Guildline Autosal 8400B salinometer (S/N 69-180) located in the hydro lab was used for all salinity measurements. Samples were analyzed after they had equilibrated to laboratory temperature, usually within 12-29 hours after collection. The salinometer was standardized for each group of analyses, 36 to 72 samples, using two fresh vials of standard seawater per group.Normal standardization procedures included flushing the cell at least 2 times with a fresh vial of IAPSO Standard Seawater (SSW, Batch P-155), setting the flow rate as low as possible during the last fill, and monitoring the STD dial setting. Samples were run using 2 flushes before the final fill. The computer determined the stability of a measurement and prompted for additional readings if there appeared to be drift. Salinity samples were drawn into 200 ml Kimax high-alumina borosilicate bottles, which were rinsed three times with the sample prior to filling. The bottles were sealed with custom-made plastic insert thimbles and kept closed with Nalgene screw caps. PSS-78 salinity [UNES81] was calculated for each sample from the measured conductivity ratios. The difference between the initial vial of standard water and the next one run as an unknown was applied as a linear function of elapsed run time to the measured ratios. The corrected salinity data were then incorporated into the cruise database. Data processing included double checking that the station, sample and box number had been correctly assigned, and reviewing the data and log files for operator comments. The salinity data were compared to CTD salinities and were used for shipboard sensor calibration.
Sampling and data processing (extracted from the TN303 cruise report section 1.12):
New pump tubes were installed before the cruise and after stations 15 and 24. Primary/secondary standards were made up at the beginning of the cruise and every 7-10 days thereafter. A total of 4 nitrite and 5 mixed (nitrate, phosphate, and silicate) standards were made over the course of the cruise. The first was compared to standards brought from shore and each subsequent set was compared to the previous set to ensure continuity between standards. The cadmium column reduction efficiency was checked periodically and ranged between 95%-100% and was replaced when less than 96%.
Nutrient samples were drawn into 40 ml polypropylene screw-capped centrifuge tubes. The tubes and caps were cleaned with 10% HCl and rinsed once with de-ionized water and 2-3 times with sample before filling. Samples were kept in a refrigerator and analyzed within fifteen hours after sample collection. They were removed from the refrigerator about an hour before being analyzed, allowing sufficient time for all samples to reach room temperature. The centrifuge tubes fit directly onto the sampler.
All data were initially reported in micromoles/Liter. NO3, PO4, and NO2 were reported to two decimal places, and SIL to one. The detection limits for the methods/instrumentation are shown in Table 1.12.2 of the cruise report.
| File |
|---|
GeoFish_Nuts_Sals_v30Oct2014.csv (Comma Separated Values (.csv), 9.39 KB) MD5:601111b3fe804e519b6d75f9740bf290 Primary data file for dataset ID 522822 |
| Parameter | Description | Units |
| EXPOCODE | expedition code assigned by the CCHDO: NODCShipCodeYearMonthDay | text |
| SECT_ID | cruise section identification number | text |
| GEOTRC_EVENTNO | GEOTRACES Event Number | dimensionless |
| Station | Station Number | dimensionless |
| GEOTRC_SAMPNO | GEOTRACES Sample Number | dimensionless |
| DATE | Station Date (GMT) in the format YYYYMMDD | unitless |
| TIME | Station Time (GMT) | HHMM |
| LATITUDE | Station Latitude (South is negative) | decimal degrees |
| LONGITUDE | Station Longitude (West is negative) | decimal degrees |
| NO3 | NO3 | umol/L |
| PO4 | PO4 | umol/L |
| SIL | SILICATE | umol/L |
| NO2 | NO2 | umol/L |
| Salinity | Salinity | PSS-78 |
| ISO_DATETIME | Date/Time (ISO formatted) | YYYY-MM-DDTHH:MM:SS[.xx]Z |
| Dataset-specific Instrument Name | |
| Generic Instrument Name | GeoFish Towed near-Surface Sampler |
| Generic Instrument Description | The GeoFish towed sampler is a custom designed near surface (2 meters or less) sampling system for the collection of trace metal clean seawater. It consists of a PVC encapsulated lead weighted torpedo and separate PVC depressor vane supporting the intake utilizing all PFA Teflon tubing connected to a deck mounted, air-driven, PFA Teflon dual-diaphragm pump which provides trace-metal clean seawater at up to 3.7L/min. The GeoFish is towed at up to 13kts off to the side of the vessel outside of the ship's wake to avoid possible contamination from the ship's hull. It was developed by Geoffrey Smith and Ken Bruland (University of California, Santa Cruz). |
TN303
| Website | |
| Platform | R/V Thomas G. Thompson |
| Report | |
| Start Date | 2013-10-25 |
| End Date | 2013-12-20 |
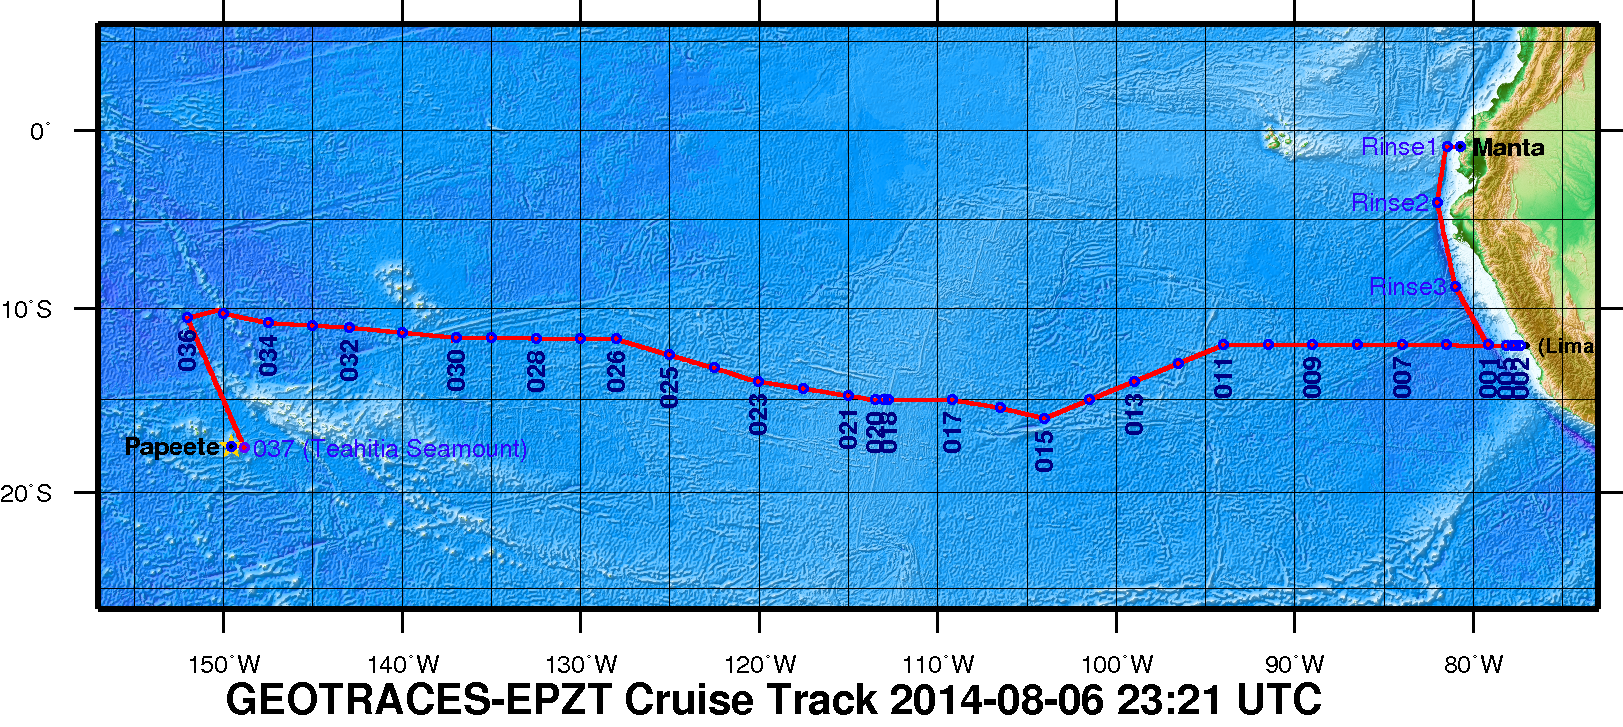
| Description | A zonal transect in the eastern tropical South Pacific (ETSP) from Peru to Tahiti as the second cruise of the U.S.GEOTRACES Program. This Pacific section includes a large area characterized by high rates of primary production and particle export in the eastern boundary associated with the Peru Upwelling, a large oxygen minimum zone that is a major global sink for fixed nitrogen, and a large hydrothermal plume arising from the East Pacific Rise. This particular section was selected as a result of open planning workshops in 2007 and 2008, with a final recommendation made by the U.S.GEOTRACES Steering Committee in 2009. It is the first part of a two-stage plan that will include a meridional section of the Pacific from Tahiti to Alaska as a subsequent expedition.
Figure 1. The 2013 GEOTRACES EPZT Cruise Track. [click on the image to view a larger version]
Additional cruise information is available from the Rolling Deck to Repository (R2R): http://www.rvdata.us/catalog/TN303 |
U.S. GEOTRACES East Pacific Zonal Transect (GP16) (U.S. GEOTRACES EPZT)
From the NSF Award Abstract
The mission of the International GEOTRACES Program (https://www.geotraces.org/), of which the U.S. chemical oceanography research community is a founding member, is "to identify processes and quantify fluxes that control the distributions of key trace elements and isotopes in the ocean, and to establish the sensitivity of these distributions to changing environmental conditions" (GEOTRACES Science Plan, 2006). In the United States, ocean chemists are currently in the process of organizing a zonal transect in the eastern tropical South Pacific (ETSP) from Peru to Tahiti as the second cruise of the U.S.GEOTRACES Program. This Pacific section includes a large area characterized by high rates of primary production and particle export in the eastern boundary associated with the Peru Upwelling, a large oxygen minimum zone that is a major global sink for fixed nitrogen, and a large hydrothermal plume arising from the East Pacific Rise. This particular section was selected as a result of open planning workshops in 2007 and 2008, with a final recommendation made by the U.S.GEOTRACES Steering Committee in 2009. It is the first part of a two-stage plan that will include a meridional section of the Pacific from Tahiti to Alaska as a subsequent expedition.
This award provides funding for management of the U.S.GEOTRACES Pacific campaign to a team of scientists from the University of Southern California, Old Dominion University, and the Woods Hole Oceanographic Institution. The three co-leaders will provide mission leadership, essential support services, and management structure for acquiring the trace elements and isotopes samples listed as core parameters in the International GEOTRACES Science Plan, plus hydrographic and nutrient data needed by participating investigators. With this support from NSF, the management team will (1) plan and coordinate the 52-day Pacific research cruise described above; (2) obtain representative samples for a wide variety of trace metals of interest using conventional CTD/rosette and GEOTRACES Sampling Systems; (3) acquire conventional JGOFS/WOCE-quality hydrographic data (CTD, transmissometer, fluorometer, oxygen sensor, etc) along with discrete samples for salinity, dissolved oxygen (to 1 uM detection limits), plant pigments, redox tracers such as ammonium and nitrite, and dissolved nutrients at micro- and nanomolar levels; (4) ensure that proper QA/QC protocols are followed and reported, as well as fulfilling all GEOTRACES Intercalibration protocols; (5) prepare and deliver all hydrographic-type data to the GEOTRACES Data Center (and US data centers); and (6) coordinate cruise communications between all participating investigators, including preparation of a hydrographic report/publication.
Broader Impacts: The project is part of an international collaborative program that has forged strong partnerships in the intercalibration and implementation phases that are unprecedented in chemical oceanography. The science product of these collective missions will enhance our ability to understand how to interpret the chemical composition of the ocean, and interpret how climate change will affect ocean chemistry. Partnerships include contributions to the infrastructure of developing nations with overlapping interests in the study area, in this case Peru. There is a strong educational component to the program, with many Ph.D. students carrying out thesis research within the program.
Figure 1. The 2013 GEOTRACES EPZT Cruise Track. [click on the image to view a larger version]
U.S. GEOTRACES (U.S. GEOTRACES)
GEOTRACES is a SCOR sponsored program; and funding for program infrastructure development is provided by the U.S. National Science Foundation.
GEOTRACES gained momentum following a special symposium, S02: Biogeochemical cycling of trace elements and isotopes in the ocean and applications to constrain contemporary marine processes (GEOSECS II), at a 2003 Goldschmidt meeting convened in Japan. The GEOSECS II acronym referred to the Geochemical Ocean Section Studies To determine full water column distributions of selected trace elements and isotopes, including their concentration, chemical speciation, and physical form, along a sufficient number of sections in each ocean basin to establish the principal relationships between these distributions and with more traditional hydrographic parameters;
* To evaluate the sources, sinks, and internal cycling of these species and thereby characterize more completely the physical, chemical and biological processes regulating their distributions, and the sensitivity of these processes to global change; and
* To understand the processes that control the concentrations of geochemical species used for proxies of the past environment, both in the water column and in the substrates that reflect the water column.
GEOTRACES will be global in scope, consisting of ocean sections complemented by regional process studies. Sections and process studies will combine fieldwork, laboratory experiments and modelling. Beyond realizing the scientific objectives identified above, a natural outcome of this work will be to build a community of marine scientists who understand the processes regulating trace element cycles sufficiently well to exploit this knowledge reliably in future interdisciplinary studies.
Expand "Projects" below for information about and data resulting from individual US GEOTRACES research projects.
| Funding Source | Award |
|---|---|
| NSF Division of Ocean Sciences (NSF OCE) | |
| NSF Division of Ocean Sciences (NSF OCE) |
[ table of contents | back to top ]