Trace elements in suspended particles from GO-Flo bottles
Project
Program
| Contributors | Affiliation | Role |
|---|---|---|
| Sherrell, Robert M. | Rutgers University | Principal Investigator |
| Twining, Benjamin | Bigelow Laboratory for Ocean Sciences | Principal Investigator |
| German, Christopher R. | Woods Hole Oceanographic Institution (WHOI) | Co-Principal Investigator |
| Fitzsimmons, Jessica N. | Texas A&M University (TAMU) | Contact |
| Ohnemus, Daniel C. | Bigelow Laboratory for Ocean Sciences | Contact |
| Rauschenberg, Sara | Bigelow Laboratory for Ocean Sciences | Contact |
| Allison, Dicky | Woods Hole Oceanographic Institution (WHOI BCO-DMO) | BCO-DMO Data Manager |
This dataset comprises all trace element measurements made on suspended particulate samples collected by filtration from GO-Flo bottles (towed fish data in a separate dataset) during the US GEOTRACES GP16 cruise, R/V Thomas G Thompson 303. It combines data produced at Bigelow Laboratory (upper water column) and at Rutgers University (intermediate and deep water column). NOTE: At station 18, near-plume depths were sampled in two separated casts deployed at two different times during the long station. The results are interleaved in this data file, but can be distinguished and separated by using sequential GEOTRACES numbers (always every other number since only every other bottle was used for particle sampling).
This dataset contains total and labile particulate element concentrations data via Inductively-coupled plasma mass spectrometry.
Trace element concentrations in suspended particles were collected from GO-Flo bottles (towed fish data are in a separate dataset) and then by filtration onto 0.45um Supor (Pall Gellman) polyethersulfone filters. Particulate matter on filters was completely digested in hot acids and resulting solutions were analyzed using inductively-coupled plasma mass spectrometry (ICP-MS). Labile (weak acid leachable) particulate element concentrations are also reported for the samples analyzed at Bigelow Labs.
Parameter names, definitions and Units:
Concentrations of total suspended particulate trace elements are indicated as the element symbol alone: Al, Ba, Cd, (Ce), Co, (Cr), Cu, Fe, La, Mn, (Nd), Ni, P, Pb, (Sc), Th, Ti, V, Y, Zn (elements in parentheses analyzed at Rutgers only). Concentrations of the labile fraction of these particulate elements are indicated as element names followed by the suffix ‘_L’. Volumetric concentrations and concentration errors for all particulate fractions (>0.45 um) are reported in units of pmol/L. The GEOTRACES sample number is in column ‘GEOTRC_SAMPNO’, and the analytical lab is found in column ‘Lab’ (where 1= Bigelow, 2=Rutgers).
Several elements were determined but are not reported here because data quality was compromised by large seasalt or process blank corrections, or because data quality simply has not been fully evaluated yet (REEs at Rutgers). However, it is possible that there is some future utility in these data, and we ask that users contact Bigelow and Rutgers who can provide the data on an individual basis. The analyzed but excluded elements include Mo, Sc, and Sr for Bigelow, and Ca, Mo, Rb, Sr, and the remaining REEs Pr, Sm, Eu, Tb, Gd, Dy, Ho, Er, Tm, Yb, and Lu for Rutgers. We expect that these REEs will be reported in a future iteration of this data report.
Uncertainties (errors) for both total and labile element concentrations are reported with the additional suffix “_Error”. (N.B. DMO changed to "_err" for consistency.)
For samples (station/depth combinations) lacking replicate analyses (i.e. most samples; flag code generally ‘2’—see below for flag code descriptions), uncertainties are reported as propagated errors accounting for each step of analysis and data processing, as described below.
Access restrictions:
It is our understanding that access to the data will be restricted to the GEOTRACES Data Management Committee (DMC) and Standards and Intercalibration Committee (SIC) until the product is publicly released in the next Intermediate Data Product, currently August, 2017.
Related files:
Blanks and Detection Limits and related derived quantities from Rutgers and Bigelow labs (png)
Median process blanks for two labs compared (pmol for 1/2 filter digested)(png)
Median percent process blank correction for reported data from two labs (png)
Total elemental recoveries for certified reference materials (CRMs) reported by each participating lab (png)
Original XL file.
Intercalibration for suspended particulate elements between Sherrell (Rutgers) and Twining (Bigelow) groups (docx)
Duplicated Depths by Lab.png
Duplicated Depths by Cast (Shallow-Intermediate).png
Deplicated Depths by Cast (Intermediate-Deep).png
Original dataset - not separated into Bottle and Fish
Total and labile particulate element concentrations via ICPMS
Sampling Methodology:
Trace metal-clean seawater samples were collected using the U.S. GEOTRACES sampling system consisting of 24 Teflon-coated GO-Flo bottles that had been pre-rinsed with a 24+ hour treatment of unfiltered subsurface seawater at the beginning of the cruise (see Cutter and Bruland, 2012 for more information on the sampling system). At each station, the bottles were deployed open and tripped on ascent at 3 m/min. On deck, the bottles were kept in the GEOTRACES trace metal clean sampling van over-pressurized with HEPA-filtered air, except immediately prior to and following deployments, during which time they were covered on both ends with plastic shower caps to avoid deck contamination.
Additional samples (in a separate dataset) were collected from surface waters (~2m) using a towed ‘fish’ deployed by Ken Bruland’s lab, and typically used to collect a surface sample upon arrival at the station location, for use as the shallowest sample of the resulting vertical concentration profile for that station. The ‘fish’ water was cleanly pumped directly into the bottom stopcock of a Go-Flo mounted vertically in the clean “bubble” (temporary clean room). Sampling then proceeded identically to procedures used for GO-Flo samples collected at depth, except that the GO-Flo was not inverted for mixing as potential particle settling time was negligible. All surface samples were analyzed by the Twining group at Bigelow Laboratory.
During sampling in the clean van, unfiltered salinity and nutrient samples were first taken from the GO-Flo bottles to create headspace, and then the bottles were inverted slowly three times to re-suspend any large particles that might have settled before sampling. Then the GO-Flo bottles were pressurized to ~0.5 atm with HEPA-filtered air, and filtration commenced using methods similar to those published in Planquette and Sherrell (2012). GO-Flo stopcocks were fitted with an acid-cleaned piece of Bev-a-Line tubing feeding into a polycarbonate elbow that that attached by Luer lock into a 25 mm, polypropylene Swinnex filter holder (http://www.millipore.com/catalogue/module/C160). These filter holders had been loaded before each cast with an acid-cleaned 25mm Supor (Pall Gelman) 0.45um polyethersulfone filter. For three shelf stations, 47mm Supor 0.45 um filters were used instead, as particle concentrations were markedly higher than at other stations. These were supported in 47 mm polypropylene filter holders (MFS; Planquette and Sherrell, 2012). Immediately prior to sampling, the headspace of the filter holder was flushed with seawater to evacuate any air bubbles to prevent air lock or occlusion of the filter surface area by air bubbles during sampling (Planquette and Sherrell, 2012). Filtration commenced with filtrate collected in a plastic bucket, and the filter holders held approximately horizontal such that any residual headspace air bubbles would rise to the top of the filter holder, avoiding occlusion of the filter face. After filtration was complete (filter clogged to <1 drop of filtrate per second) or two hours had passed since the start of filtration, filtration was ceased by closing the stopcock on the GO-Flo bottle. Seawater volume passed through the filter was measured and recorded. The Swinnex filter holders were taken into HEPA-filtered clean space, and excess headspace seawater was removed by gentle vacuum suction through the filter. The filter holders were then transferred in a sealed plastic bag to the HEPA-filtered “bubble” clean room in the ship’s main lab. Working directly under a vertically flowing HEPA hood, the filter holders were opened, and the filter was removed using Tefzel forceps (held by only the edge of the filter). The non-sampled side of the filter was “blotted” by placing onto an acid-cleaned 47mm Supor filter to remove remaining seawater by capillary action. Finally, the visibly dry filter was placed into an acid-cleaned polystyrene PetriSlide (EMD Millipore), with the filter positioned such that the inner rim of the lid was positioned over one edge of the filter, thus acting as a stabilizing device to limit subsequent movement of the filter within the PetriSlide, and stored at -20 degC for transport and storage until analysis at Bigelow Laboratory or Rutgers University.
Analytical Methodology:
Bigelow Laboratory
All digestion steps were performed in a Class-100 clean room using standard clean techniques. Filters were cut in half using a ceramic blade, using a cutting template and a light table to aid precision. One half was digested following the protocol of Berger et al. (2008) to obtain labile particulate concentrations; the other was digested using a 4M HCl, 4M HNO3, and 4M HF mixture as described in Ohnemus et al. (2014) to obtain total particulate element concentrations. Labile particulate filter halves were leached in a solution of 25pcnt Optima-grade acetic acid and 0.02 M hydroxylamine hydrochloride following the protocol of Berger et al. (2008). One milliliter of this solution was added to the filter stored in a 1.7 mL polypropylene vial. Following the recommendation of Berger et al. (2008), the solution was heated to 95 degC in a water bath for 10 minutes and then allowed to cool to room temperature. The filter was in contact with the acetic acid leach for a total of two hours, after which the filter was removed from the polypropylene vial and the acetic acid/hydroxylamine leachate was centrifuged at 14,000 rpm for 10 minutes to sediment all particles. Without disturbing particles on the bottom of the tube, approximately 0.8 mL of leachate was transferred into an acid-cleaned 7 mL PFA digestion vial. Optima-grade HNO3was added (100 uL) to the digestion vial, which was subsequently heated uncapped at 110 degC to near dryness. Vial contents were redissolved with 2pcnt HNO3 (Optima grade).
Total particulate metals were determined by digestion of the second filter half. The filter was transferred to a rigorously cleaned 22-mL PFA vial, 2 mL of a solution containing 4M HCl, 4M HNO3, and 4M HF (all Optima grade) was added to completely cover the filter piece, and the vial was tightly capped and heated to 110 degC for 4 hours. This procedure has been determined to be adequate for digestion of all particulate material, while allowing the Supor filter to remain intact (Ohnemus et al. 2014). Following heating, the acid solution in the bomb was poured into a second PFA vial, leaving the filter piece behind. To ensure complete transfer of acid, the bombs were thoroughly rinsed with 3 × 0.5 mL aliquots of ultrapure water which were poured into the secondary vial. The secondary vial was then heated to dryness and the contents redissolved with 2 mL of a 50 pcnt Optima-grade HNO3 + 15 pcnt Optima-grade H2O2 (v/v of concentrated reagents) solution. This solution was again dried down and the contents redissolved with 2 pcnt HNO3.
Filter halves from depths typically greater than 150m outside the oxygen minimum zone (stations 15-36) were digested only in the HCl/HNO3/HF solution to provide a total particulate element fraction; no corresponding labile particulate concentration data have been collected for these samples.
All digests were analyzed using a Finnigan-MAT Element2 HR-ICP-MS at the University of Maine following the protocols outlined in Twining et al. (2011). The instrument is equipped with a cyclonic nebulizer, an autosampler contained under a HEPA filter, and nickel cones. Ba-137, Cd-111, La-139, Th-232, and Y-89 were analyzed in low-resolution mode, and the remaining isotopes were analyzed in medium-resolution mode. Y-89 was analyzed in both low- and medium-resolution modes, and the values reported are derived from the low-resolution mode values. Multiple isotopes were analyzed for some elements, and the isotopes used to derive the reported concentration are as follows for each element: Fe (56 and 57), Cu (63 and 65), Ni (60 and 62), Zn (66, 64 and 68). Mean agreement was 1.7 pcnt for the two Cu isotopes, 3.2 pcnt for the two Fe isotopes, 7.6 pcnt for the two Ni isotopes, and 1.3 to 2.9 pcnt for the Zn isotopes. Between low and medium instrument resolution modes, mean agreement was 0.4pcnt for Y-89. Quantification was performed by external calibration, and In-115 was used as an internal standard to correct for variations in instrumental sensitivity during analyses.
Cs-133, spiked during the initial sample digestions, was used as a process recovery monitor, but no samples were discarded or corrected using the Cs recoveries, as typical Cs recoveries were 95-105pcnt.
Rutgers University
Samples were analyzed in the Sherrell laboratory at Rutgers University. Frozen filters were cut in half using a ceramic rotary blade; a filter-cutting template was illuminated on a light table for guidance during cutting, and filter cutting error performed on blank filters was found to be ≤2% by weight. One filter half was used for sample digestion (reported here), and the other filter half was used for archiving or for acid leaching of “labile” metals (to be reported at a later date). For digestion, filter halves were placed into the bottom of acid-clean 15 mL PFA vials (Savillex), and 0.4 mL of Milli-Q ultrapure water was added to the top. Once it was fully wetted, the filter half was pulled up the side of the vial and adhered to the wall, curved side toward bottom of vial. Then 0.6 mL of a solution containing 16.7 pcnt (v/v) hydrofluoric acid (HF, Optima grade, Fisher) and 83.3 pcnt (v/v) nitric acid (HNO3, Optima grade, Fisher) was added by pipet to each vial, aiming at the adhered filter half. The final digestion acid mixture was thus 1.0 mL of a solution containing 8M HNO3 and 2.9M HF. The vial was then capped tightly and placed on a Teflon hotplate at least 2 cm from other vials to allow air circulation. These “bombs” were refluxed at 135 degC for 4 hours. After cooling, solution was gathered to the bottom of the vials, lids were removed, and the digest solution was evaporated until ~5-10 µL of solution remained. At that point, 100 uL of concentrated HNO3 was added, and the solution was re-evaporated until ~5-10 µL of solution remained. The additional HNO3 dry-down encourages evaporative loss of HF. Evaporating to dryness was avoided to prevent “baking” sample residue onto the Teflon surface, thus aiding in complete re-dissolution and minimizing carry-over to subsequent sample digestions. Finally, the remaining droplet was brought up in 3.0 mL of 5 pcnt HNO3 (v/v) and transferred to a 15 mL acid-cleaned polypropylene centrifuge tube for archiving prior to analysis.
Sample analysis was completed on a Finnigan-MAT Element-1 inductively coupled plasma mass spectrometer, employing a PFA Microflow nebulizer (ESI), an Apex and ACM sequential desolvation system (ESI) to reduce molecular oxide ion formation, and Ni cones. Sample solutions were diluted five times from the archived digest solutions (to reduce chemical matrix effects) and were quantified using nine-point, multi-element standard curves with acid matrix identical to that of samples and concentrations bracketing the range of the samples. Single-point standard additions were run every 10 samples to check for accuracy, and analytical replicates were made every 10 samples to monitor analytical precision.
To monitor overall process recovery, a high Cs spike was added at the start of sample digestion. Analysis of Cs in the final digest solution showed that recovery was always 100±5%, so no samples were discarded or corrected for process recovery.
Bigelow Laboratory
All ICP-MS elemental concentration data were normalized to an In-115 internal standard and quantified using external standard curves. After accounting for sample dilutions due to acid digestion steps, quantities of each element per filter (pmol/filter) were calculated for each analytical run. The contribution of the ‘process blank’ (measured as the elements contained in an acid-washed filter through which 0.2-µm filtered water was passed during the cruise) was then subtracted. Process blanks from 25-mm diameter filters used at most stations (all but stations 2-4) were pooled across ICP-MS runs and from across the cruise section. Separate process blanks were calculated for the labile (acetic acid/hydroxylamine) and total (HCl/HNO3/HF) digestions. The median process blanks for each digestion scheme and each element are given in the ‘Blanks and DetLimits’ sheet of the attached Excel workbook ‘GP16 Go-Flo Particles Blank and CRM metadata’. Two process blanks of the 47-mm diameter Supor filters used at nearshore stations 2-4 were found to be insufficient to rigorously determine the blank levels for that filter size due to a flier in one of the two blank replicates. A filter-area-scaled process blank was instead derived from the 25-mm filter data and used to correct the 47-mm samples; these scaled blanks largely agreed with the non-flier 47-mm replicate.
Following process blank correction, element concentrations (per volume of water filtered) were calculated by dividing the determined pmol/filter by the volume of water passed through each filter (measured volumetrically on the ship following each filtration).
The factor ultimately limiting our ability to detect particulate elements, which varies across the elemental suite as discussed in Ohnemus et al. (2014) and Twining et al (2015), is typically the observed variability in process blanks (i.e., the filter substrates). We calculate and report dataset-wide detection limits as 2 times (labile digests and total Al) or 3 times (all remaining elements) the standard deviation of the process blanks for the relevant digestion procedure (total or labile) after pooling of process blanks from across the transect, which did not appear to vary significantly as a function of collection location. Lower (2 S.D.) detection limits were set for the labile elements and total Al, at the expense of larger uncertainties, to allow visualization of complete profiles especially in the ultra-low surface samples of many offshore stations. The mean elemental content of the process blank (pmol/filter) was converted to concentration units using the average volume filtered for GO-Flo samples (7.6 L). Details of the detection limits used are given in the ‘Blanks and DetLimits’ sheet of the attached Excel workbook ‘GP16 Go-Flo Particles Blank and CRM metadata.xlsx’
Rutgers University
The following describes how raw ICP-MS data were transformed into particulate metal concentration data. The intensities (counts per second) from the ICP-MS runs were corrected for instrument blank (evaluated using a 0.8 M nitric acid solution that matched the acid matrix of the samples as analyzed) and were normalized for mass spectrometer sensitivity drift by correction to the internal standard indium-115, which was added to all samples at a constant 1.0 ng/mL concentration. Corrections were made for MoO interferences on Cd using a Mo standard that was evaluated in each analytical session (<0.5% correction in all cases). A 9-point standard curve bracketing the range of sample concentrations was evaluated at the beginning and end of each analytical session, and the drift-corrected slopes of these curves for each element were evaluated and averaged; these slopes nearly always agreed to within 5%. The drift-corrected average slope was then used to determine the concentration of each element in the 5x-diluted digest solutions. Single point standard addition checks on every 10th sample yielded agreement with standard curve quantification to within 5% depending on element; no corrections were made on the basis of these accuracy checks. After correction for dilution and division by seawater volume filtered through the half-filter piece, the elemental concentrations in seawater were corrected for process blank. The process blanks consisted of Supor filters that had 2.0 L (occasionally as little as 1.1 L or as much as 2.3 L) of 0.2 µm-filtered seawater passed through them during sampling at sea. Process blanks were collected from a variety of locations and depths throughout the cruise (n=18); no trend in these blanks as a function of particle concentration in the seawater was observed, suggesting that particles smaller than 0.2 µm did not contribute significantly to the elemental composition of the process blank filter. These process blank filters were cut and digested as for normal samples, and the absolute moles of each element were corrected for elemental contributions from residual seasalt using the Na data, assuming that all Na was solely derived from seasalt and using the mean seawater ratio of all measured elements to Na. The median seasalt-corrected process blank for each element was then subtracted from each particle concentration. The only additional blank that was subtracted was a 20 pM (seawater concentration) blank subtraction for all samples for Cu to improve intercalibration with the upper ocean samples measured by the Twining lab and to compensate for an uncorrected Cu background specific to our ICP-MS introduction system. Finally, all particulate metal concentrations were corrected for contributions from residual seasalt that had dried on the filter, using Na determinations as for the process blanks. The median seasalt correction was <1% for all reported elements except Cd (2%), Ni (1%), P (1%), V (3%). Maximum seasalt correction for any reported element was 14% (V).
Error calculation (Bigelow and Rutgers)
Error propagation on the final seawater particulate concentrations was completed using the following errors for each analyte: a conservative 3% filter cutting error (same for all elements), the instrumental relative standard deviation (RSD) on the metal and indium counts during measurement, the standard deviation on the analytical replicates of the 5% nitric acid instrument blank during each analytical session, the error about the mean of the averaged standard curve slope, the standard deviation of the multiple process blanks used to determine the median process blank for subtraction, and the instrumental RSD on the Na signal for used for seasalt subtraction (this last step Rutgers only).
Description of data quality flags
The standard Ocean Data View flags were used (reference all flags at https://www.bodc.ac.uk/data/codes_and_formats/odv_format/):
1: Good Value: Good quality data value that is not part of any identified malfunction and has been verified as consistent with real phenomena during the quality control process (reproducible).
2: Probably Good Value: Data value that is probably consistent with real phenomena but this is unconfirmed or data value forming part of a malfunction that is considered too small to affect the overall quality of the data object of which it is a part. [Used when the reported value reflects analysis of a single replicate.]
3: Probably Bad Value: Data value recognized as unusual during quality control that forms part of a feature that is probably inconsistent with real phenomena. [Used when a value appears abnormally high or low (oceanographically inconsistent) based on: a) adjacent depths and b) typical profile variability and shape using the context of relevant nearby stations; and/or c) intercomparison of samples from the two GO-Flo particulate-TM datasets presented here.]
4: Bad Value: An obviously erroneous data value. [Not used.]
6: Value Below Detection Limit: The level of the measured phenomenon was too small to be quantified by the technique employed to measure it. The accompanying value is the detection limit for the technique or zero if that value is unknown. [We report an empty value rather than zero or a detection limit value.]
9: Missing Value: The data value is missing. Any accompanying value will be a magic number representing absent data. [All samples collected were analyzed. Any missing data was not analyzed or was analyzed but is not (or not yet) reported.]
Additional GEOTRACES Processing by BCO-DMO:
As was done for the GEOTRACES-NAT data, BCO-DMO added standard US GEOTRACES information, such as the US GEOTRACES event number, to each submitted dataset lacking this information. To accomplish this, BCO-DMO compiled a 'master' dataset composed of the following parameters:
cruise_id, EXPOCODE,SECT_ID, STNNBR, CASTNO, GEOTRC_EVENTNO, GEOTRC_SAMPNO, GEOTRC_INSTR, SAMPNO, GF_NO, BTLNBR, BTLNBR_FLAG_W, DATE_START_EVENT, TIME_START_EVENT, ISO_DATETIME_UTC_START_EVENT, EVENT_LAT, EVENT_LON, DEPTH_MIN, DEPTH_MAX, BTL_DATE, BTL_TIME, BTL_ISO_DATETIME_UTC, BTL_LAT, BTL_LON, ODF_CTDPRS, SMDEPTH, FMDEPTH, BTMDEPTH, CTDPRS, CTDDEPTH.
This added information will facilitate subsequent analysis and inter-comparison of the datasets.
Bottle parameters in the master file were taken from the GT-C_Bottle and ODF_Bottle datasets. Non-bottle parameters, including those from GeoFish tows, Aerosol sampling, and McLane Pumps, were taken from the TN303 Event Log (version 30 Oct 2014). Where applicable, pump information was taken from the PUMP_Nuts_Sals dataset.
A standardized BCO-DMO method (called "join") was then used to merge the missing parameters to each US GEOTRACES dataset, most often by matching on sample_GEOTRC or on some unique combination of other parameters.
If the master parameters were included in the original data file and the values did not differ from the master file, the original data columns were retained and the names of the parameters were changed from the PI-submitted names to the standardized master names. If there were differences between the PI-supplied parameter values and those in the master file, both columns were retained. If the original data submission included all of the master parameters, no additional columns were added, but parameter names were modified to match the naming conventions of the master file.
See the dataset parameters documentation for a description of which parameters were supplied by the PI and which were added via the join method.
| File |
|---|
part_elem_BOT_join.csv (Comma Separated Values (.csv), 468.56 KB) MD5:9d69d23aa17025f57f5e999ce2fd843d Primary data file for dataset ID 639847 |
| Parameter | Description | Units |
| cruise_id | cruise identification; the GEOTRACES EZPT cruise | text |
| STNNBR | station number | number |
| GEOTRC_SAMPNO | GEOTRACES sample number | number |
| depth_GEOTRC_CTD | depth of water where data were collected; not to be confused with water depth | meters |
| Lab | analytical lab where work was done; 1= Bigelow; 2= Rutgers | text |
| Al_TP_CONC_BOTTLE | concentration of total suspended particulate Aluminum | picomoles per liter |
| Ba_TP_CONC_BOTTLE | concentration of total suspended particulate Barium | picomoles per liter |
| Cd_TP_CONC_BOTTLE | concentration of total suspended particulate Cadmium | picomoles per liter |
| Ce_TP_CONC_BOTTLE | concentration of total suspended particulate Cerium | picomoles per liter |
| Co_TP_CONC_BOTTLE | concentration of total suspended particulate Cobalt | picomoles per liter |
| Cr_TP_CONC_BOTTLE | concentration of total suspended particulate Chromium | picomoles per liter |
| Cu_TP_CONC_BOTTLE | concentration of total suspended particulate Copper | picomoles per liter |
| Fe_TP_CONC_BOTTLE | concentration of total suspended particulate Iron | picomoles per liter |
| La_TP_CONC_BOTTLE | concentration of total suspended particulate Lanthanum | picomoles per liter |
| Mn_TP_CONC_BOTTLE | concentration of total suspended particulate Manganese | picomoles per liter |
| Nd_TP_CONC_BOTTLE | concentration of total suspended particulate Neodymium | picomoles per liter |
| Ni_TP_CONC_BOTTLE | concentration of total suspended particulate Nickel | picomoles per liter |
| P_TP_CONC_BOTTLE | concentration of total suspended particulate Phosphorus | picomoles per liter |
| Pb_TP_CONC_BOTTLE | concentration of total suspended particulate Lead | picomoles per liter |
| Sc_TP_CONC_BOTTLE | concentration of total suspended particulate Scandium | picomoles per liter |
| Th_TP_CONC_BOTTLE | concentration of total suspended particulate Thorium | picomoles per liter |
| Ti_TP_CONC_BOTTLE | concentration of total suspended particulate Titanium | picomoles per liter |
| V_TP_CONC_BOTTLE | concentration of total suspended particulate Vanadium | picomoles per liter |
| Y_TP_CONC_BOTTLE | concentration of total suspended particulate Yttrium | picomoles per liter |
| Zn_TP_CONC_BOTTLE | concentration of total suspended particulate Zinc | picomoles per liter |
| Al_TP_err | uncertainty for total suspended particulate Aluminum concentration | picomoles per liter |
| Ba_TP_err | uncertainty for total suspended particulate Barium concentration | picomoles per liter |
| Cd_TP_err | uncertainty for total suspended particulate Cadmium concentration | picomoles per liter |
| Ce_TP_err | uncertainty for total suspended particulate Cerium concentration | picomoles per liter |
| Co_TP_err | uncertainty for total suspended particulate Cobalt concentration | picomoles per liter |
| Cr_TP_err | uncertainty for total suspended particulate Chromium concentration | picomoles per liter |
| Cu_TP_err | uncertainty for total suspended particulate Copper concentration | picomoles per liter |
| Fe_TP_err | uncertainty for total suspended particulate Iron concentration | picomoles per liter |
| La_TP_err | uncertainty for total suspended particulate Lanthanum concentration | picomoles per liter |
| Mn_TP_err | uncertainty for total suspended particulate Manganese concentration | picomoles per liter |
| Nd_TP_err | uncertainty for total suspended particulate Neodymium concentration | picomoles per liter |
| Ni_TP_err | uncertainty for total suspended particulate Nickel concentration | picomoles per liter |
| P_TP_err | uncertainty for total suspended particulate Phosphorus concentration | picomoles per liter |
| Pb_TP_err | uncertainty for total suspended particulate Lead concentration | picomoles per liter |
| Sc_TP_err | uncertainty for total suspended particulate Scandium concentration | picomoles per liter |
| Th_TP_err | uncertainty for total suspended particulate Thorium concentration | picomoles per liter |
| Ti_TP_err | uncertainty for total suspended particulate Titanium concentration | picomoles per liter |
| V_TP_err | uncertainty for total suspended particulate Vanadium concentration | picomoles per liter |
| Y_TP_err | uncertainty for total suspended particulate Yttrium concentration | picomoles per liter |
| Zn_TP_err | uncertainty for total suspended particulate Zinc concentration | picomoles per liter |
| Total particulate concentration quality flags (Al;Ba;Ce;Co;Cr;Cu;Fe;La;Mn;Nd;Ni;P;Pb;Sc;Th;Ti;V;Y;Zn) | see Processing Metadata for explanation | text |
| Al_TPL_CONC_BOTTLE | concentration of labile fraction of trace metal Aluminum | picomoles per liter |
| Ba_TPL_CONC_BOTTLE | concentration of labile fraction of trace metal Barium | picomoles per liter |
| Cd_TPL_CONC_BOTTLE | concentration of labile fraction of trace metal Cadmium | picomoles per liter |
| Co_TPL_CONC_BOTTLE | concentration of labile fraction of trace metal Cobalt | picomoles per liter |
| Cu_TPL_CONC_BOTTLE | concentration of labile fraction of trace metal Copper | picomoles per liter |
| Fe_TPL_CONC_BOTTLE | concentration of labile fraction of trace metal Iron | picomoles per liter |
| La_TPL_CONC_BOTTLE | concentration of labile fraction of trace metal Lanthanum | picomoles per liter |
| Mn_TPL_CONC_BOTTLE | concentration of labile fraction of trace metal Manganese | picomoles per liter |
| Ni_TPL_CONC_BOTTLE | concentration of labile fraction of trace metal Nickel | picomoles per liter |
| P_TPL_CONC_BOTTLE | concentration of labile fraction of trace metal Phosphorus | picomoles per liter |
| Pb_TPL_CONC_BOTTLE | concentration of labile fraction of trace metal Lead | picomoles per liter |
| Th_TPL_CONC_BOTTLE | concentration of labile fraction of trace metal Thorium | picomoles per liter |
| Ti_TPL_CONC_BOTTLE | concentration of labile fraction of trace metal Titanium | picomoles per liter |
| V_TPL_CONC_BOTTLE | concentration of labile fraction of trace metal Vanadium | picomoles per liter |
| Y_TPL_CONC_BOTTLE | concentration of labile fraction of trace metal Yttrium | picomoles per liter |
| Zn_TPL_CONC_BOTTLE | concentration of labile fraction of trace metal Zinc | picomoles per liter |
| Al_TPL_err | uncertainty for labile fraction of trace metal Aluminum | picomoles per liter |
| Ba_TPL_err | uncertainty for labile fraction of trace metal Barium | picomoles per liter |
| Cd_TPL_err | uncertainty for labile fraction of trace metal Cadmium | picomoles per liter |
| Co_TPL_err | uncertainty for labile fraction of trace metal Cobalt | picomoles per liter |
| Cu_TPL_err | uncertainty for labile fraction of trace metal Copper | picomoles per liter |
| Fe_TPL_err | uncertainty for labile fraction of trace metal Iron | picomoles per liter |
| La_TPL_err | uncertainty for labile fraction of trace metal Lanthanum | picomoles per liter |
| Mn_TPL_err | uncertainty for labile fraction of trace metal Manganese | picomoles per liter |
| Ni_TPL_err | uncertainty for labile fraction of trace metal Nickel | picomoles per liter |
| P_TPL_err | uncertainty for total suspended particulate Phosphorus concentration | picomoles per liter |
| Pb_TPL_err | uncertainty for labile fraction of trace metal Lead | picomoles per liter |
| Th_TPL_err | uncertainty for labile fraction of trace metal Thorium | picomoles per liter |
| Ti_TPL_err | uncertainty for labile fraction of trace metal Titanium | picomoles per liter |
| V_TPL_err | uncertainty for labile fraction of trace metal Vanadium | picomoles per liter |
| Y_TPL_err | uncertainty for labile fraction of trace metal Yttrium | picomoles per liter |
| Zn_TPL_err | uncertainty for labile fraction of trace metal Zinc | picomoles per liter |
| Labile fraction concentration quality flags (Al;Ba;Cd;Co;Cu;Fe;La;Mn;Ni;P;Pb;Th;Ti;V;Y;Zn) | see Processing Metadata for explanation | text |
| CASTNO | Cast Number. Values were added from the intermediate US GEOTRACES master file (see Processing Description). | unitless |
| GEOTRC_EVENTNO | GEOTRACES Event Number. Values were added from the intermediate US GEOTRACES master file (see Processing Description). | unitless |
| SAMPNO | Sample number. Values were added from the intermediate US GEOTRACES master file (see Processing Description). | unitless |
| BTLNBR | Bottle number. Values were added from the intermediate US GEOTRACES master file (see Processing Description). | unitless |
| BTLNBR_FLAG_W | Bottle quality flag: 2 = good; 3 = questionable; 4 = bad; 9 = missing data. Values were added from the intermediate US GEOTRACES master file (see Processing Description). | unitless |
| ISO_DATETIME_UTC_START_EVENT | ISO 8601:2004 standard date and time at start of event. Values were added from the intermediate US GEOTRACES master file (see Processing Description). | YYYY-MM-DDTHH:MM:SS[.xx]Z |
| BTL_ISO_DATETIME_UTC | ISO 8601:2004 standard date and time of bottle firing. Values were added from the intermediate US GEOTRACES master file (see Processing Description). | YYYY-MM-DDTHH:MM:SS[.xx]Z |
| BTL_LAT | Latitude of bottle firing; north is positive. Values were added from the intermediate US GEOTRACES master file (see Processing Description). | decimal degrees |
| BTL_LON | Longitude of bottle firing; east is positive. Values were added from the intermediate US GEOTRACES master file (see Processing Description). | decimal degrees |
| Dataset-specific Instrument Name | GO-Flo bottle |
| Generic Instrument Name | GO-FLO Bottle |
| Generic Instrument Description | GO-FLO bottle cast used to collect water samples for pigment, nutrient, plankton, etc. The GO-FLO sampling bottle is specially designed to avoid sample contamination at the surface, internal spring contamination, loss of sample on deck (internal seals), and exchange of water from different depths. |
| Dataset-specific Instrument Name | Finnigan-MAT Element* HR-ICP-MS |
| Generic Instrument Name | Mass Spectrometer |
| Dataset-specific Description | Finnigan MAT (Element2, by Bigelow lab) High Resolution Inductively Coupled Plasma Mass Spectrometer.
Finnigan MAT (Element1, by Rutgers University) High Resolution Inductively Coupled Plasma Mass Spectrometer. |
| Generic Instrument Description | General term for instruments used to measure the mass-to-charge ratio of ions; generally used to find the composition of a sample by generating a mass spectrum representing the masses of sample components. |
TN303
| Website | |
| Platform | R/V Thomas G. Thompson |
| Report | |
| Start Date | 2013-10-25 |
| End Date | 2013-12-20 |
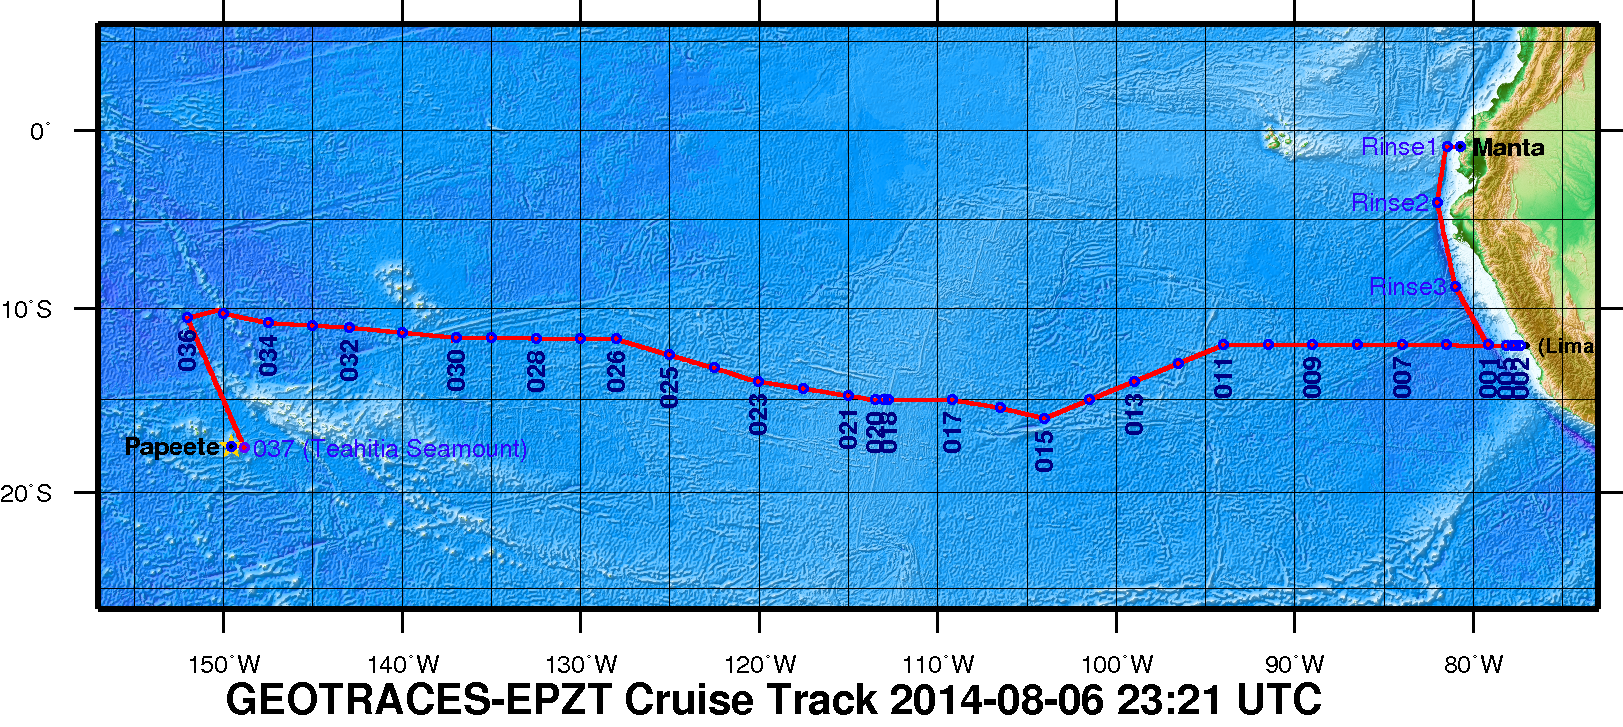
| Description | A zonal transect in the eastern tropical South Pacific (ETSP) from Peru to Tahiti as the second cruise of the U.S.GEOTRACES Program. This Pacific section includes a large area characterized by high rates of primary production and particle export in the eastern boundary associated with the Peru Upwelling, a large oxygen minimum zone that is a major global sink for fixed nitrogen, and a large hydrothermal plume arising from the East Pacific Rise. This particular section was selected as a result of open planning workshops in 2007 and 2008, with a final recommendation made by the U.S.GEOTRACES Steering Committee in 2009. It is the first part of a two-stage plan that will include a meridional section of the Pacific from Tahiti to Alaska as a subsequent expedition.
Figure 1. The 2013 GEOTRACES EPZT Cruise Track. [click on the image to view a larger version]
Additional cruise information is available from the Rolling Deck to Repository (R2R): http://www.rvdata.us/catalog/TN303 |
U.S. GEOTRACES East Pacific Zonal Transect (GP16) (U.S. GEOTRACES EPZT)
From the NSF Award Abstract
The mission of the International GEOTRACES Program (https://www.geotraces.org/), of which the U.S. chemical oceanography research community is a founding member, is "to identify processes and quantify fluxes that control the distributions of key trace elements and isotopes in the ocean, and to establish the sensitivity of these distributions to changing environmental conditions" (GEOTRACES Science Plan, 2006). In the United States, ocean chemists are currently in the process of organizing a zonal transect in the eastern tropical South Pacific (ETSP) from Peru to Tahiti as the second cruise of the U.S.GEOTRACES Program. This Pacific section includes a large area characterized by high rates of primary production and particle export in the eastern boundary associated with the Peru Upwelling, a large oxygen minimum zone that is a major global sink for fixed nitrogen, and a large hydrothermal plume arising from the East Pacific Rise. This particular section was selected as a result of open planning workshops in 2007 and 2008, with a final recommendation made by the U.S.GEOTRACES Steering Committee in 2009. It is the first part of a two-stage plan that will include a meridional section of the Pacific from Tahiti to Alaska as a subsequent expedition.
This award provides funding for management of the U.S.GEOTRACES Pacific campaign to a team of scientists from the University of Southern California, Old Dominion University, and the Woods Hole Oceanographic Institution. The three co-leaders will provide mission leadership, essential support services, and management structure for acquiring the trace elements and isotopes samples listed as core parameters in the International GEOTRACES Science Plan, plus hydrographic and nutrient data needed by participating investigators. With this support from NSF, the management team will (1) plan and coordinate the 52-day Pacific research cruise described above; (2) obtain representative samples for a wide variety of trace metals of interest using conventional CTD/rosette and GEOTRACES Sampling Systems; (3) acquire conventional JGOFS/WOCE-quality hydrographic data (CTD, transmissometer, fluorometer, oxygen sensor, etc) along with discrete samples for salinity, dissolved oxygen (to 1 uM detection limits), plant pigments, redox tracers such as ammonium and nitrite, and dissolved nutrients at micro- and nanomolar levels; (4) ensure that proper QA/QC protocols are followed and reported, as well as fulfilling all GEOTRACES Intercalibration protocols; (5) prepare and deliver all hydrographic-type data to the GEOTRACES Data Center (and US data centers); and (6) coordinate cruise communications between all participating investigators, including preparation of a hydrographic report/publication.
Broader Impacts: The project is part of an international collaborative program that has forged strong partnerships in the intercalibration and implementation phases that are unprecedented in chemical oceanography. The science product of these collective missions will enhance our ability to understand how to interpret the chemical composition of the ocean, and interpret how climate change will affect ocean chemistry. Partnerships include contributions to the infrastructure of developing nations with overlapping interests in the study area, in this case Peru. There is a strong educational component to the program, with many Ph.D. students carrying out thesis research within the program.
Figure 1. The 2013 GEOTRACES EPZT Cruise Track. [click on the image to view a larger version]
GEOTRACES Pacific Section: Characterizing biogenic trace elements across productivity and oxygen gradients in the eastern South Pacific (South Pacific biogenic trace elements)
Incorporation of trace elements (TE) into plankton, and the chemical, geological, biological and biochemical mechanisms which influence this process, are of central importance to our understanding of the biogeochemical functioning of the oceans. Bioactive TEs such as Fe, Zn, Co, Cu and Ni have the potential to control ocean productivity, ecosystem structure, and the utilization of macronutrients in large regions of the global ocean. Numerous laboratory studies have been performed to study the responses of cellular TE quotas in model strains to varying environmental conditions, but accurate measurements of TE stoichiometries in cells and biogenic material collected from natural communities are rare. Measurements of bulk particulate TE stoichiometries typically rely on comparison to laboratory results to assess the biogenic component, precluding study of cellular responses to geochemical gradients.
In this project, investigators at the Bigelow Laboratory for Ocean Sciences and the University of Maine will measure TEs in plankton cells representing major functional groups and in bulk particulate matter along the US GEOTRACES South Pacific Zonal Transect from Peru to Tahiti in 2013. U.S.GEOTRACES is the US component of the international GEOTRACES program which was initiated to advance our knowledge of the concentrations, physical and chemical speciation, and spatial distributions of TEs in the ocean. The Pacific transect will run from a highly productive eastern boundary upwelling system with an intense oxygen minimum zone to the southeast Pacific gyre, one of the world's most oligotrophic regimes. Specifically, the investigators expect to accomplish the following objectives: (1) Measure cellular quotas of P, Si, Mn, Fe, Co, Ni, Cu and Zn in major functional groups of phytoplankton across horizontal productivity gradients in the eastern tropical South Pacific Ocean; (2) Measure cellular quotas of P, Si, Mn, Fe, Co, Ni, Cu and Zn in phytoplankton and bacteria across vertical redox gradients in the OMZ of the eastern tropical South Pacific Ocean; ( 3) Measure total and labile concentrations of Al, Ti, P, Mn, Fe, Co, Ni, Cu, Zn, Cd, V and Mo in bulk particulate material collected from the upper 500 m with GO-Flo bottles.
Broader Impacts: The broader impacts and environmental relevance of this research will be communicated to educators and the general public through a dedicated webinar series to be organized in coordination with COSEE-Ocean Systems. This series will involve 5 webinars delivered sequentially and covering the science results produced by this project, as well as results and synthesis from four other GEOTRACES projects from the South Pacific cruise. These seminars will describe the broader goals and significance of the international GEOTRACES program, promoting this global geochemical program to educators and citizens, as well as synthesizing findings on various aspects of the project (dissolved, particulate, and biogenic trace metals; metal binding ligands; natural radionuclide tracers). Information from GEOTRACES will also be introduced to undergraduate students through Bigelow's REU program and through an undergraduate course being taught to students at nearby Colby College.
GEOTRACES: Suspended particle geochemistry along the US GEOTRACES Eastern Pacific Zonal Transect, from high productivity ocean margin to deep sea hydrothermal plume (GEOTRACES EPZT Suspended Particles)
During the 2013 GEOTRACES Eastern Pacific cruise a diverse range of oceanic environments will be encountered from the high productivity/high particle flux waters off Peru to the Peru-Chile oxygen minimum zone, the hydrothermal plume of the East Pacific Rise, and finally to some of the most oligotrophic waters around Tahiti. Scientists from Rutgers University and Woods Hole Oceanographic Institution will sample suspended particulates from the same GO-Flo bottles that will be used to sample dissolved trace metals and their isotopes (TEIs) across this entire transect. The suspended matter samples will be analyzed for 42 elements, including the particle-reactive rare earth elements. In addition, core-top sediments will be collected at every water-column sampling station and analyzed for both bulk composition (i.e., relative % content of organic carbon, opal, biogenic carbonate and lithogenic components) and the same 42 elements to be analyzed in the suspended particulates. Results from this study will be used to assess the role of suspended particulates in the biogeochemical cycling of TEIs across the Eastern Pacific by addressing three key sets of questions: (1) How does uptake of TEIs into phytoplankton and non-living particles in the upper ocean drive the suspended particulate composition through the deeper water column, along the substantial gradient from the high productivity Peru margin to the oligotrophic ocean interior?; (2) How faithfully is the along-transect variability in the upper ocean transmitted to the sediment (paleo) record?; (3) What are the relative influences of vertical recycling versus lateral advection in generating the distributions of dissolved and particulate TEIs observed in the Peru-Chile OMZ?; (4) Is there a characteristic signature of OMZ activity that is preserved in core-top sediments?; (5) What dominates TEI uptake onto/into authigenic particles in hydrothermal plumes and to what extent are these processes augmented by continuing uptake in core-top sediments?; and (6) What is the net effect from submarine venting on global TEI budgets?
As regards broader impacts, the scientist from Rutgers University is collaborating with the Education Director of the Centers for Ocean Science Education Excellence Networked Ocean World (COSEE-NOW) to contribute to the MARE (Marine Activities, Resources, and Education) program by inviting teachers and high school students to workshops and presentations on climate and ocean sciences. With the help of COSEE-NOW, he also plans to create educational video clips during the Pacific cruise and the subsequent laboratory based analytical work to educate them on the use of geochemistry to understand how the ocean works. Both scientists also plan to develop a teaching module entitled "Particles, Metals, and Carbon" for an Introduction to Oceanography class taught by the Rutgers scientist. One postdoc from Rutgers University would be supported and trained as part of this project.
U.S. GEOTRACES (U.S. GEOTRACES)
GEOTRACES is a SCOR sponsored program; and funding for program infrastructure development is provided by the U.S. National Science Foundation.
GEOTRACES gained momentum following a special symposium, S02: Biogeochemical cycling of trace elements and isotopes in the ocean and applications to constrain contemporary marine processes (GEOSECS II), at a 2003 Goldschmidt meeting convened in Japan. The GEOSECS II acronym referred to the Geochemical Ocean Section Studies To determine full water column distributions of selected trace elements and isotopes, including their concentration, chemical speciation, and physical form, along a sufficient number of sections in each ocean basin to establish the principal relationships between these distributions and with more traditional hydrographic parameters;
* To evaluate the sources, sinks, and internal cycling of these species and thereby characterize more completely the physical, chemical and biological processes regulating their distributions, and the sensitivity of these processes to global change; and
* To understand the processes that control the concentrations of geochemical species used for proxies of the past environment, both in the water column and in the substrates that reflect the water column.
GEOTRACES will be global in scope, consisting of ocean sections complemented by regional process studies. Sections and process studies will combine fieldwork, laboratory experiments and modelling. Beyond realizing the scientific objectives identified above, a natural outcome of this work will be to build a community of marine scientists who understand the processes regulating trace element cycles sufficiently well to exploit this knowledge reliably in future interdisciplinary studies.
Expand "Projects" below for information about and data resulting from individual US GEOTRACES research projects.
| Funding Source | Award |
|---|---|
| NSF Division of Ocean Sciences (NSF OCE) | |
| NSF Division of Ocean Sciences (NSF OCE) | |
| NSF Division of Ocean Sciences (NSF OCE) |
[ table of contents | back to top ]