Dissolved trace metal concentrations from a GO-FLO rosette collected during the R/V Thomas G. Thompson cruise TN303 from Peru to Tahiti in 2013 (U.S. GEOTRACES EPZT project)
Project
Program
| Contributors | Affiliation | Role |
|---|---|---|
| Bruland, Kenneth W. | University of California-Santa Cruz (UCSC) | Principal Investigator, Contact |
| Till, Claire P. | University of California-Santa Cruz (UCSC) | Contact |
| Allison, Dicky | Woods Hole Oceanographic Institution (WHOI BCO-DMO) | BCO-DMO Data Manager |
Abstract
Dissolved trace metals on the eastern half of the transect (plus a few other locations) in samples taken from the GEOTRACES GO-FLO rosette and filtered through a 0.2 um Acropak capsule filter.
Revision history:
06 May 2016 - these data were updated with new values for some Copper samples.
06 June 2016 - revised again when joined to Master Event File and split into Bottle and Fish columns.
29 November 2016 - replaced values in Fe_D_CONC_BOTTLE column that were less than zero with "BDL" (below detection limit). The following are the negative values originally reported:
GT sample 3560 -- Fe_D_CONC_BOTTLE = -0.05
GT sample 3812 -- Fe_D_CONC_BOTTLE = -0.02
GT sample 3913 -- Fe_D_CONC_BOTTLE = -0.07
GT sample 3998 -- Fe_D_CONC_BOTTLE = -0.02
Sampling:
Sample bottles were Low Density Polyethylene (LDPE) bottles and cleaned in accordance with the GEOTRACES cookbook (http://www.geotraces.org/images/stories/documents/intercalibration/Cookbook.pdf). Sample bottles were stored in weak (~0.1 N) HNO3, and were emptied before shipping.
Samples were collected using the U.S. GEOTRACES sampling system of 24 Teflon-coated GO-FLO bottles (Cutter and Bruland, 2012). At each station, the bottles were deployed open and tripped on ascent at 3 m/min. GO-FLOs were sampled in the GEOTRACES trace metal clean sampling van that contained HEPA-filtered air.
During sampling, the GO-FLO bottles were pressurized to ~0.4 atm with HEPA-filtered air, and their spigots were fitted with an acid-cleaned piece of Bev-a-Line tubing that fed into an Acropak-200 Supor capsule filter (0.2 µm pore size made of polyethersulfone). Before use, this filter had been filled with filtered surface seawater that had been acidifed to pH 2 with trace metal clean HCl and left overnight to rinse. Before collecting any subsamples, at least 500mL of seawater was passed through the filter (while eliminating air bubbles in the capsule reservoir). Sample bottles were rinsed three times with 10% sample volume before filling. Acropak filters were used for at most 3 casts before a new filter was used, and they were stored empty in a refrigerator while not in use. GEOFish surface samples were taken using an all-plastic "towed fish" pumping system as described in Bruland et al. 2005 at approximately 3 m depth and were similarly filtered and sampled.
Samples were acidified at sea with the equivalent of 4mL quartz-distilled 6M HCl per liter of seawater (resulting in pH 1.7-1.8). Samples were sitting acidified for several months before analysis back in the laboratory.
Analysis:
Samples were analyzed with an adaptation of Biller and Bruland (2012). For this method, 24 mL of sample was pipetted into 30 mL teflon jars with quartz lids, and spiked with In and Lu to 5 nM (natural concentrations of In and La are sub pM, so this spike overwhelms the natural concentrations). This In and Lu spike is used as a check of consistent recovery across different resin columns and sampling days. The samples were UV irradiated for 2 hours to break the chelation of the organic complexes on Co and Cu. We had observed that 2 hours in our UV irradiation box is sufficient to plateau the concentrations of Cu and Co. After UV irradiation, samples lids were changed from lids with quartz-inserts to fully-teflon lids, and the samples were allowed to sit at least overnight.
Samples were pre-concentrated on resin columns of Nobias-chelate PA1 resin (IDA and EDTA functional groups). We use 8 columns at a time, and therefore pre-concentrate 8 samples at a time. Columns are stored in weak (~0.1N) HNO3, and every day before samples are analyzed, the columns are cleaned with alternating pH 6 seawater, 1N HNO3, and pH 6 rinse/conditioning solution (0.05M NH4Ac). Just before pre-concentration on resin columns, 8 samples were buffered to pH 5.7-6.2 with an NH4Ac buffer, inverted and weighed. For each set of samples, the columns are conditioned with the rinse/conditioning solution (to get the columns the correct pH before the sample arrives), then loaded with the sample, then rinsed with the rinse/conditioning solution (to remove the salts) and then eluted with ~1 mL of 1M quartz-distilled HNO3. The eluent vials are weighed before and after elution, and the (now empty) sample jars are weighed as well. This method results in a concentration factor of about 24.
Column blanks were determined for each column by following the same procedure for samples, but loading a low-metal seawater for just 1 min rather than the 40 min a sample usually takes to load. Reagent blanks were determined by analyzing low-metal seawater twice normally (rx1) and twice with double the reagents (rx2; reagent doubled include the acid used to originally acidify the sample, the buffer used to get the sample to pH 5.7-6.2, and the In/Lu spike). In this way, the rx2 sample was the correct pH for analysis, but contained twice the amount of blank from the reagents. The difference between the rx2 and rx1 was used as the reagent blank.
Standards were made by spiking low-metal seawater and analyzing the standards in the same manner as the samples. The resulting standard curve was compared with a standard curve made in clean eluent. This allowed us to calculate and monitor the percent recovery of each metal over time. We also had a Mo standard curve that allowed us to correct for the MoO interference on Cd.
We analyzed samples, reference samples, standards and blanks in the Thermo-Element high resolution XR ICP-MS at UCSC. Consistently throughout the XR run, we ran clean eluent and a QC, to monitor drift of the instrument and changes in the instrument blank. We used the clean eluent as our “instrument blank.” To monitor drift in the blank of our columns and preconcentration procedure, we also ran “internal QC” samples, which are seawater samples from a large volume of homogenous seawater that our lab analyzed once every ~16 samples. We also ran every 4th sample in duplicate.
Data Processing:
We used the seawater standard calibration curve for each metal. We subtracted the instrument, column, and reagent blanks from each metal. We monitored the percent recovery for each metal and checked that reference samples analyzed and processed in the same way resulted in reasonable values.
We had a frequent contamination issue with Cu, Ni and Zn contamination, which we observed in the same ratios across many samples. We have had this problem in the past in our lab, but have yet to determine the cause. Due to the consistent ratios in the contamination, this was easily spotted and the impacted data removed from the dataset.
DMO notes:
took out first column. put it in header description.
changed 'nodata' to nd
took out 'n/a' in last station; replaced with nd. (illegal character)
changed precision of measurements to reflect PI instructions:
- Round to one decimal place: Y, Cd, Pb, Co, Ga
- Round to two decimal places: La, Ce, Sc, Mn, Fe, Ni, Cu, Zn
- changed variable names to conform to NAT and current GT where applicable
Joined and split into BOTTLE and FISH
Additional GEOTRACES Processing by BCO-DMO:
As was done for the GEOTRACES-NAT data, BCO-DMO added standard US GEOTRACES information, such as the US GEOTRACES event number, to each submitted dataset lacking this information. To accomplish this, BCO-DMO compiled a 'master' dataset composed of the following parameters:
cruise_id, EXPOCODE,SECT_ID, STNNBR, CASTNO, GEOTRC_EVENTNO, GEOTRC_SAMPNO, GEOTRC_INSTR, SAMPNO, GF_NO, BTLNBR, BTLNBR_FLAG_W, DATE_START_EVENT, TIME_START_EVENT, ISO_DATETIME_UTC_START_EVENT, EVENT_LAT, EVENT_LON, DEPTH_MIN, DEPTH_MAX, BTL_DATE, BTL_TIME, BTL_ISO_DATETIME_UTC, BTL_LAT, BTL_LON, ODF_CTDPRS, SMDEPTH, FMDEPTH, BTMDEPTH, CTDPRS, CTDDEPTH.
This added information will facilitate subsequent analysis and inter-comparison of the datasets.
Bottle parameters in the master file were taken from the GT-C_Bottle and ODF_Bottle datasets. Non-bottle parameters, including those from GeoFish tows, Aerosol sampling, and McLane Pumps, were taken from the TN303 Event Log (version 30 Oct 2014). Where applicable, pump information was taken from the PUMP_Nuts_Sals dataset.
A standardized BCO-DMO method (called "join") was then used to merge the missing parameters to each US GEOTRACES dataset, most often by matching on sample_GEOTRC or on some unique combination of other parameters.
If the master parameters were included in the original data file and the values did not differ from the master file, the original data columns were retained and the names of the parameters were changed from the PI-submitted names to the standardized master names. If there were differences between the PI-supplied parameter values and those in the master file, both columns were retained. If the original data submission included all of the master parameters, no additional columns were added, but parameter names were modified to match the naming conventions of the master file.
See the dataset parameters documentation for a description of which parameters were supplied by the PI and which were added via the join method.
| File |
|---|
trace_metals_joined.csv (Comma Separated Values (.csv), 168.26 KB) MD5:9995fa33d4459207ad63dc31ff859d6d Primary data file for dataset ID 643423 |
| Parameter | Description | Units |
| STNNBR | station number | number |
| CASTNO | GEOTRACES cast number | number |
| GEOTRC_EVENTNO | GEOTRACES event number | number |
| GEOTRC_SAMPNO | GEOTRACES sample number | number |
| DATE_START_EVENT | sample date | yyyymmdd |
| lat_PI | latitude of the cast | decimal degrees; Negative is South |
| lon_PI | longitude of the cast | decimal degrees; Negative is West |
| BTMDEPTH | water depth | meters |
| CTDDEPTH | depth where the water was collected from the bottle | meters |
| BTLNBR | bottle number; typically 1-24 | unitless |
| ISO_DATETIME_UTC_START_EVENT | Date and time formatted to the ISO 8601 standard at the start of the sampling event according to the event log. | YYYY-MM-DDTHH:MM:SS[.xx]Z |
| Y_D_CONC_BOTTLE | concentration of dissolved Yttrium from GoFLO bottle | picomoles per kilogram |
| Cd_D_CONC_BOTTLE | concentration of dissolved Cadmium from GoFLO bottle | picomoles per kilogram |
| La_D_CONC_BOTTLE | concentration of dissolved Lanthanum from GoFLO bottle | picomoles per kilogram |
| Pb_D_CONC_BOTTLE | concentration of dissolved Lead from GoFLO bottle | picomoles per kilogram |
| Ce_D_CONC_BOTTLE | concentration of dissolved Cerium from GoFLO bottle | picomoles per kilogram |
| Sc_D_CONC_BOTTLE | concentration of dissolved Scandium from GoFLO bottle | picomoles per kilogram |
| Mn_D_CONC_BOTTLE | concentration of dissolved Manganese from GoFLO bottle | nanomoles per kilogram |
| Fe_D_CONC_BOTTLE | concentration of dissolved Iron from GoFLO bottle. BDL = below detection limit; this means the very low values (less than zero) were reported for these samples. | nanomoles per kilogram |
| Co_D_CONC_BOTTLE | concentration of dissolved Cobalt from GoFLO bottle | picomoles per kilogram |
| Ni_D_CONC_BOTTLE | concentration of dissolved Nickel from GoFLO bottle | nanomoles per kilogram |
| Cu_D_CONC_BOTTLE | concentration of dissolved Copper from GoFLO bottle | nanomoles per kilogram |
| Zn_D_CONC_BOTTLE | concentration of dissolved Zinc from GoFLO bottle | nanomoles per kilogram |
| Ga_D_CONC_BOTTLE | concentration of dissolved Gallium from GoFLO bottle | picomoles per kilogram |
| Y_D_CONC_FISH | concentration of dissolved Yttrium from SuperGeo-Fish | picomoles per kilogram |
| Cd_D_CONC_FISH | concentration of dissolved Cadmium from SuperGeo-Fish | picomoles per kilogram |
| La_D_CONC_FISH | concentration of dissolved Lanthanum from SuperGeo-Fish | picomoles per kilogram |
| Pb_D_CONC_FISH | concentration of dissolved Lead from SuperGeo-Fish | picomoles per kilogram |
| Ce_D_CONC_FISH | concentration of dissolved Cerium from SuperGeo-Fish | picomoles per kilogram |
| Sc_D_CONC_FISH | concentration of dissolved Scandium from SuperGeo-Fish | picomoles per kilogram |
| Mn_D_CONC_FISH | concentration of dissolved Manganese from SuperGeo-Fish | nanomoles per kilogram |
| Fe_D_CONC_FISH | concentration of dissolved Iron from SuperGeo-Fish | nanomoles per kilogram |
| Co_D_CONC_FISH | concentration of dissolved Cobalt from SuperGeo-Fish | picomoles per kilogram |
| Ni_D_CONC_FISH | concentration of dissolved Nickel from SuperGeo-Fish | nanomoles per kilogram |
| Cu_D_CONC_FISH | concentration of dissolved Copper from SuperGeo-Fish | nanomoles per kilogram |
| Zn_D_CONC_FISH | concentration of dissolved Zinc from SuperGeo-Fish | nanomoles per kilogram |
| Ga_D_CONC_FISH | concentration of dissolved Gallium from SuperGeo-Fish | picomoles per kilogram |
| BTL_LAT | Latitude of bottle firing; north is positive. | decimal degrees |
| BTL_LON | Longitude of bottle firing; east is positive. | decimal degrees |
| Dataset-specific Instrument Name | Thermo-Element high resolution XR ICP-MS |
| Generic Instrument Name | Inductively Coupled Plasma Mass Spectrometer |
| Dataset-specific Description | Inductively coupled plasma Mass Spectrometer |
| Generic Instrument Description | An ICP Mass Spec is an instrument that passes nebulized samples into an inductively-coupled gas plasma (8-10000 K) where they are atomized and ionized. Ions of specific mass-to-charge ratios are quantified in a quadrupole mass spectrometer. |
TN303
| Website | |
| Platform | R/V Thomas G. Thompson |
| Report | |
| Start Date | 2013-10-25 |
| End Date | 2013-12-20 |
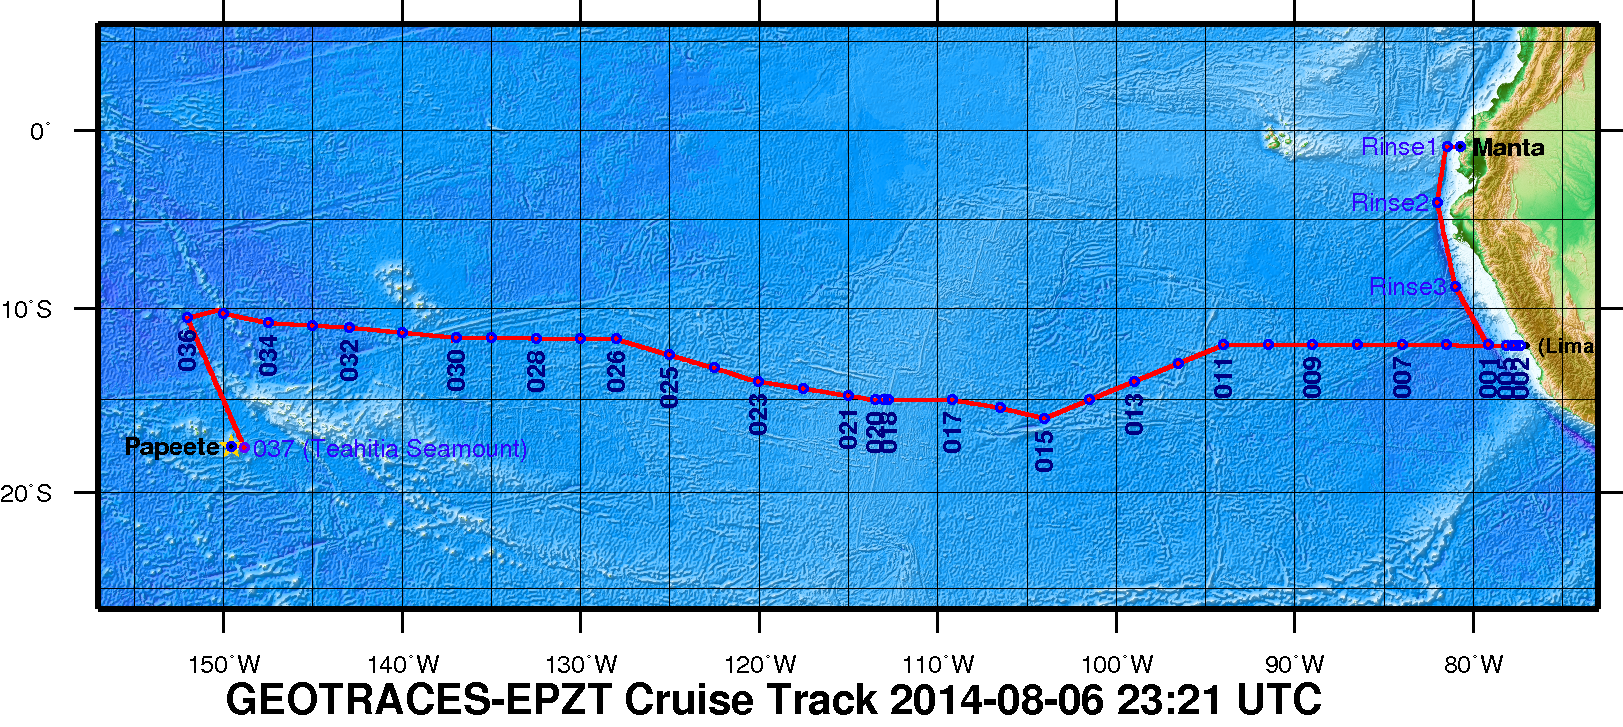
| Description | A zonal transect in the eastern tropical South Pacific (ETSP) from Peru to Tahiti as the second cruise of the U.S.GEOTRACES Program. This Pacific section includes a large area characterized by high rates of primary production and particle export in the eastern boundary associated with the Peru Upwelling, a large oxygen minimum zone that is a major global sink for fixed nitrogen, and a large hydrothermal plume arising from the East Pacific Rise. This particular section was selected as a result of open planning workshops in 2007 and 2008, with a final recommendation made by the U.S.GEOTRACES Steering Committee in 2009. It is the first part of a two-stage plan that will include a meridional section of the Pacific from Tahiti to Alaska as a subsequent expedition.
Figure 1. The 2013 GEOTRACES EPZT Cruise Track. [click on the image to view a larger version]
Additional cruise information is available from the Rolling Deck to Repository (R2R): http://www.rvdata.us/catalog/TN303 |
U.S. GEOTRACES East Pacific Zonal Transect (GP16) (U.S. GEOTRACES EPZT)
From the NSF Award Abstract
The mission of the International GEOTRACES Program (https://www.geotraces.org/), of which the U.S. chemical oceanography research community is a founding member, is "to identify processes and quantify fluxes that control the distributions of key trace elements and isotopes in the ocean, and to establish the sensitivity of these distributions to changing environmental conditions" (GEOTRACES Science Plan, 2006). In the United States, ocean chemists are currently in the process of organizing a zonal transect in the eastern tropical South Pacific (ETSP) from Peru to Tahiti as the second cruise of the U.S.GEOTRACES Program. This Pacific section includes a large area characterized by high rates of primary production and particle export in the eastern boundary associated with the Peru Upwelling, a large oxygen minimum zone that is a major global sink for fixed nitrogen, and a large hydrothermal plume arising from the East Pacific Rise. This particular section was selected as a result of open planning workshops in 2007 and 2008, with a final recommendation made by the U.S.GEOTRACES Steering Committee in 2009. It is the first part of a two-stage plan that will include a meridional section of the Pacific from Tahiti to Alaska as a subsequent expedition.
This award provides funding for management of the U.S.GEOTRACES Pacific campaign to a team of scientists from the University of Southern California, Old Dominion University, and the Woods Hole Oceanographic Institution. The three co-leaders will provide mission leadership, essential support services, and management structure for acquiring the trace elements and isotopes samples listed as core parameters in the International GEOTRACES Science Plan, plus hydrographic and nutrient data needed by participating investigators. With this support from NSF, the management team will (1) plan and coordinate the 52-day Pacific research cruise described above; (2) obtain representative samples for a wide variety of trace metals of interest using conventional CTD/rosette and GEOTRACES Sampling Systems; (3) acquire conventional JGOFS/WOCE-quality hydrographic data (CTD, transmissometer, fluorometer, oxygen sensor, etc) along with discrete samples for salinity, dissolved oxygen (to 1 uM detection limits), plant pigments, redox tracers such as ammonium and nitrite, and dissolved nutrients at micro- and nanomolar levels; (4) ensure that proper QA/QC protocols are followed and reported, as well as fulfilling all GEOTRACES Intercalibration protocols; (5) prepare and deliver all hydrographic-type data to the GEOTRACES Data Center (and US data centers); and (6) coordinate cruise communications between all participating investigators, including preparation of a hydrographic report/publication.
Broader Impacts: The project is part of an international collaborative program that has forged strong partnerships in the intercalibration and implementation phases that are unprecedented in chemical oceanography. The science product of these collective missions will enhance our ability to understand how to interpret the chemical composition of the ocean, and interpret how climate change will affect ocean chemistry. Partnerships include contributions to the infrastructure of developing nations with overlapping interests in the study area, in this case Peru. There is a strong educational component to the program, with many Ph.D. students carrying out thesis research within the program.
Figure 1. The 2013 GEOTRACES EPZT Cruise Track. [click on the image to view a larger version]
GEOTRACES Pacific Section: Surface Sampling with the GeoFish and Dissolved Trace Metals on the Peru to East Pacific Rise Section (EPZT trace metals)
Extracted from the NSF award abstract:
There is a paucity of data for trace metals in the South Pacific Ocean and limited, if any, data is available for the eastern tropical South Pacific. As such, the U.S. GEOTRACES cruise in 2013 along a zonal section in the eastern tropical South Pacific will help fill this void. A scientist from the University of California-Santa Cruz plans to determine the distributions of a suite of trace metals between Peru and the East Pacific Rise to examine the influence of (1) the large lateral gradient in productivity and particle flux related to the coastal upwelling region off Peru and inputs from the continental margin, and (2) the intense and extensive oxygen minimum zone (OMZ) in the eastern tropical South Pacific off Peru. The key trace metals to be determined are dissolved iron, manganese, copper, zinc, cadmium, and lead, as well as nickel, cobalt, gallium, yttrium, titanium, and lanthanum. A subset of the samples will also be analyzed for silver. Besides the vertical profiles for these elements, the GeoFish sampling system will be used during the cruise to collect surface water samples that will be analyzed for the same suite of elements. The scientist will also participate in various intercomparison exercises with collaborators on the GEOTRACES program to ensure data quality for trace metals mentioned above, collect uncontaminated samples for other researchers at each of the vertical stations, and make the GeoFish sample tubing available to anyone requiring surface samples.
U.S. GEOTRACES (U.S. GEOTRACES)
GEOTRACES is a SCOR sponsored program; and funding for program infrastructure development is provided by the U.S. National Science Foundation.
GEOTRACES gained momentum following a special symposium, S02: Biogeochemical cycling of trace elements and isotopes in the ocean and applications to constrain contemporary marine processes (GEOSECS II), at a 2003 Goldschmidt meeting convened in Japan. The GEOSECS II acronym referred to the Geochemical Ocean Section Studies To determine full water column distributions of selected trace elements and isotopes, including their concentration, chemical speciation, and physical form, along a sufficient number of sections in each ocean basin to establish the principal relationships between these distributions and with more traditional hydrographic parameters;
* To evaluate the sources, sinks, and internal cycling of these species and thereby characterize more completely the physical, chemical and biological processes regulating their distributions, and the sensitivity of these processes to global change; and
* To understand the processes that control the concentrations of geochemical species used for proxies of the past environment, both in the water column and in the substrates that reflect the water column.
GEOTRACES will be global in scope, consisting of ocean sections complemented by regional process studies. Sections and process studies will combine fieldwork, laboratory experiments and modelling. Beyond realizing the scientific objectives identified above, a natural outcome of this work will be to build a community of marine scientists who understand the processes regulating trace element cycles sufficiently well to exploit this knowledge reliably in future interdisciplinary studies.
Expand "Projects" below for information about and data resulting from individual US GEOTRACES research projects.
| Funding Source | Award |
|---|---|
| NSF Division of Ocean Sciences (NSF OCE) |
[ table of contents | back to top ]