Model results containing monthly Lagrangian transition probability distributions in the S. California Bight from 1996-2007
Project
| Contributors | Affiliation | Role |
|---|---|---|
| Siegel, David | University of California-Santa Barbara (UCSB-ERI) | Principal Investigator |
| Simons, Rachel D. | University of California-Santa Barbara (UCSB-ERI) | Co-Principal Investigator |
| Kinkade, Danie | Woods Hole Oceanographic Institution (WHOI BCO-DMO) | BCO-DMO Data Manager |
Model output and related files (described below) are available from the project website.
Monthly_Cij_Files_1996_2007.zip- Zip file containing monthly Lagrangian transition probability distributions from 1996 to 2007 from and to the 135 sites in the Southern California Bight. Results are provided as three-dimensional matrices (source_index, destination_index, advection_time) in Matlab .mat format.
Additional/Supplemental files:
ConnectivityMatrixManipulationExample.m– Matlab .m script file that calculates mean connectivity matrices for given advection time and estimates mean and minimum oceanographic times and from the monthly Particle Distribution Function (PDF) matrices. Will run on the unzipped monthly Cij folders with this program in the same directory.
plot_connect_funky.m- Matlab .m function that plots connectivity matrices with site locations.
site_centers.mat- Matlab .mat file of the latitude and longitude for the center for each of the 135 sites.
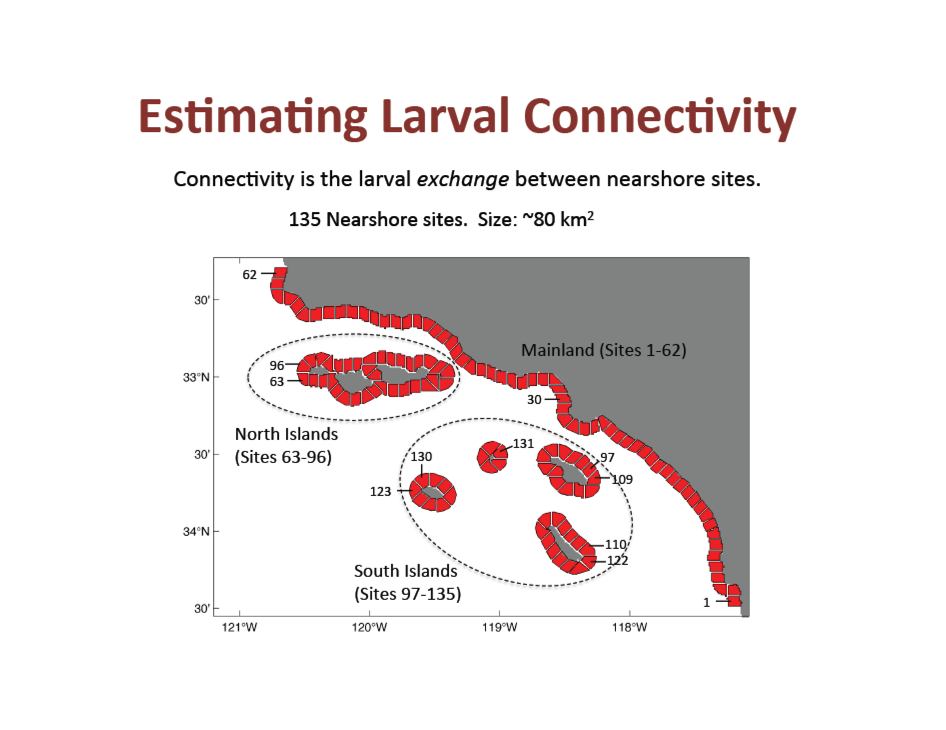
SBC_sites_map.pdf– graphical representation of the 135 sites around the Southern California Bight (also below).
Model Output - Monthly_Cij_Files_1996_2007.zip: This zip file contains monthly Lagrangian transition probability distributions from 1996 to 2007 from and to the 135 sites in the Southern California Bight. Advection times range from 1 to 70 days, particles are water-following (no behavior) and particles are release at each source location averaged over the upper 30 m of the water column. Details of the calculations are provided in Mitarai et al. [2009] and Simons et al. [2013]. Results are provided as three-dimensional matrices (source_index, destination_index, advection_time) in Matlab .mat format. The monthly .mat files are organized into folders for each year. Each connect_MM.mat file contains one month of data with the MM referencing the months from 01-12.In each connect_MM.mat file is a 135x135x70 matrix called connect.Matrix. The matrix dimensions are 135x135x70 (i,j,k). The i-dimension is the index for the 135 destination sites. The j-dimension is the index for the 135 source sites. The i- and j-dimensions are probabilities. The k-dimension is the index for the advection time in days.
Mitarai, S., D. A. Siegel, J. R. Watson, C. Dong, and J. C. McWilliams. 2009. Quantifying connectivity in the coastal ocean with application to the Southern California Bight. Journal of Geophysical Research-Oceans 114.
Simons, R.D., D.A. Siegel, K.S. Brown, 2013: Model sensitivity and robustness in the estimation of larval transport: A study of particle tracking parameters. Journal of Marine Systems,119-12, 19-29.
Quantifying the importance of biological factors in the estimation of larval connectivity and population dynamics in the coastal ocean (larval connectivity)
(Extracted from the NSF Award Abstract)
Larval connectivity, which quantifies the intensity and pathways of connections among populations through the dispersal of larvae, is a critical factor in marine population dynamics and has broad reaching consequences for marine spatial planning and fisheries management. Biophysical models, consisting of ocean circulation models combined with Lagrangian particle tracking, are now widely used to provide insights into the spatial and temporal dynamics of larval connectivity that remain unobtainable through empirical approaches. However, many of the biological assumptions used to characterize larval life history in these models are quite general and the impacts of these assumptions have yet to be rigorously tested. The goal of this project is to quantify How important are the details of larval biology in estimates of connectivity and long-term population dynamics? To answer this question, the investigators will study the spatial and temporal impacts of larval biological factors on site-to-site connectivity and long-term population growth using a biophysical model for near shore species in the Southern California Bight (SCB). Four major, larval biological factors will be investigated: (1) temperature effects on larval growth, maturation and mortality, (2) vertical swimming behavior, (3) spatial/temporal variability in larval production, and (4) role of habitat on settlement. Using a biophysical model of the SCB, differences in larval connectivity due to the biological factors will be assessed statistically by comparing connectivity estimates that incorporate the additional biological factors to a baseline of connectivity estimates calculated from passive, neutrally buoyant particles. The investigators will also employ a spatial demographic model, driven by the connectivity estimates, to quantify the influence of biological factors on long-term population dynamics. The project will generate significant insights into the various aspects of larval biology that are critical for determining larval connectivity and for projecting population dynamics into the future. The results of this project will improve the credible application of biophysical modeling approaches to scientific studies of coastal species as well as to marine spatial planning and fisheries management.
| Funding Source | Award |
|---|---|
| NSF Division of Ocean Sciences (NSF OCE) |
[ table of contents | back to top ]