Laboratory experiment analyzing the photosynthetic and calcification rates of Pleurochrysis carterae (Ocean acidification effects on copes and coccoliths project)
Project
Program
| Contributors | Affiliation | Role |
|---|---|---|
| Balch, William M. | Bigelow Laboratory for Ocean Sciences | Principal Investigator, Contact |
| Fields, David | Bigelow Laboratory for Ocean Sciences | Co-Principal Investigator |
| White, Meredith | Bigelow Laboratory for Ocean Sciences | Contact |
| Ake, Hannah | Woods Hole Oceanographic Institution (WHOI BCO-DMO) | BCO-DMO Data Manager |
| Allison, Dicky | Woods Hole Oceanographic Institution (WHOI BCO-DMO) | BCO-DMO Data Manager |
Photosynthetic and calcification rates of Pleurochrysis carterae at three pCO2 levels.
Cultures: Pleurochrysis carterae cultures were maintained in exponential growth phase under axenic conditions in semi-continuous batch culture using L1-Si media prepared on 0.2 um-filtered, UV-sterilized, autoclaved seawater. Cultures were acclimated to one of three pCO2 treatments for over 9 generations before experiments were performed.
pCO2: Carbonate chemistry was manipulated by bubbling cultures and prepared media with 500 mL/min^-1 with 0.2 um-filtered 280, 380, or 750 ppm pCO2 air. The pCO2 levels of the treatment air were established using two mass flow controllers (Aalborg, Orangeburg, NY, USA) for each treatment to precisely mix in-house compressed air and pure CO2 (Maine Oxy, Auburn, ME, USA). The in-house compressed air was stripped of CO2 to less than 10 ppm CO2 using a Puregas VCD CO2 Adsorber (Puregas, LLC, Broomfield, CO, USA). The pCO2 of the gas mixtures was stable to 8 ppm.
Length of Incubation (hours): Number of hours that algae were incubated with 14C-bicarbonate.
Cell density (cells/mL-1): Culture density measured using a Moxi Z mini automated cell counter (ORFLO Technologies, Ketchum, ID, USA), which has a coefficient of variation of 4%.
Photosynthetic rate (ug C/L^-1 d^-1) and Calcification rate (ug C/L^-1 d^-1): Triplicate samples from each pCO2 treatment were spiked with 14C-HCO3- and incubated at 16.5 +/- 0.5 degrees Celsius and 415 umol photons/m^-2/s^-1 PAR for 3 h. At the end of the incubation, the cells from each replicate, along with triplicate formalin-killed blanks for each pCO2 treatment, were filtered onto 0.4 um polycarbonate filters and their carbon was partitioned into organic and inorganic fractions by acidification and subsequent capture of 14CO2 (from PIC) in a trap containing a Whatman GFA filter presoaked with 0.2 mL phenethylamine (see Balch et al. 2000 for detailed methodology). The radioactivity of each fraction was measured on a Packard Tri-Carb 2750 LL scintillation counter (acquired by Perkin Elmer, Waltham, MA, USA) and the photosynthetic rate and calcification rate were calculated from the organic carbon and inorganic carbon fractions, respectively, using the equation on p. 118 from Parsons et al. (1984) and applying appropriate unit conversions:
Photosynthesis OR Calcification (mg C • (m^3)^-1 d^-1) = [(Rs – Rb) * W * 1.05]/(R * t)
Where R is the total activity (dpm) of bicarbonate added; t is the length of incubation (in days); Rs is the sample count (dpm), Rb is the formalin blank count (dpm), and W is the weight of total carbon dioxide present in mg C • (m^3)^-1, determined from the expression W=12,000*TC, where TC is the total carbon dioxide, which can be approximated from salinity, as described in Parsons et al. (1984). The factor of 1.05 accounts for preferential uptake of 12C. The calculation is the same for photosynthetic rate and calcification rate – the difference is using the sample count from either the organic fraction or the inorganic fraction, respectively.
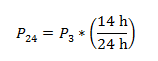
Photosynthetic rate corrected to 14:10 L:D cycle (ug C / L^-1 d^-1): Because our cultures are maintained in an incubator with a 14-10 h light-dark cycle, and our photosynthetic rate (P3) was extrapolated to a per day rate based on a 3 h light incubation, we corrected for our 14 h day to obtain a true 24 h day photosynthetic rate (P24) as follows:
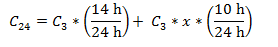
Calcification rate corrected to 14:10 L:D cycle (ug C / L^-1 d^-1): Because our cultures are maintained in an incubator with a 14-10 h light-dark cycle, and our calcification rate (C3) was extrapolated to a per day rate based on a 3 h light incubation, we corrected for our 14 h day to obtain a true 24 h day calcification rate (C24). In a separate experiment we determined that calcification in P. carterae is somewhat, but not entirely, light dependent, so we calculated x, the proportion of light calcification that is representative of dark calcification for each pCO2 treatment as follows:
x(280) = 0.0092
x(380) = 0.1983
x(750) = 0.2191
We then corrected C3 to C24 as follows:
Photosynthetic and calcification rates corrected to cell density (ug C / cell^-1 / d^-1): To obtain P24 and C24 rates on a per cell basis, rates were divided by cell density and then by a volume conversion factor.
Photosynthetic and calcification rates corrected to cell density (pmol C / cell^-1 / d^-1): Standard unit conversion factors were applied to get photosynthetic and calcification rates in terms of pmol organic C or pmol CaCO3 cell^-1 day^-1, respectively.
Calcification/Photosynthesis: To obtain a particulate inorganic carbon to particulate organic carbon ratio (PIC / POC^-1), the calcification rate was divided by the photosynthetic rate.
DMO notes:
- added underscores and removed spaces and units from column names
- changed column names to comply with BCO-DMO standards.
- added "na" to blank cells in columns where SD and mean were calculated
| File |
|---|
photo_calc_rates.csv (Comma Separated Values (.csv), 1.19 KB) MD5:b8a6e44a6f1dd2b2f9597048d73457fa Primary data file for dataset ID 651520 |
| Parameter | Description | Units |
| replicate | Denotes the three replicates for each pCO2 treatment. | unitless |
| CO2_treatment | The independent variable; one of three pCO2 levels: 280 ppm; 380 ppm; 750 ppm | parts per million |
| cell_density | Density of cells in each replicate. | cells per milliliter |
| photo_rate | Rate of organic carbon production by Pleurochrysis based on a 3 h incubation in the light; divided by 0.125 (3 h/24 h) to give a rate per day. | micrograms per liter per day |
| calcification_rate | Rate of inorganic carbon production by Pleurochrysis based on a 3 h incubation in the light, but divided by 0.125 (3 h/24 h) to give a rate per day. | micrograms per liter per day |
| photoRate_LDcycle | Rate of organic carbon production by Pleurochrysis corrected to a 14-10 h light-dark cycle. | micrograms per liter per day |
| calcRate_LDcycle | Rate of inorganic carbon production by Pleurochrysis corrected to a 14-10 h light-dark cycle taking into consideration calcification in the dark. | micrograms per liter per day |
| photoRate_cellDensity_ugC | P24 corrected to the cell density of the replicate to give a per cell photosynthetic rate. | micrograms per cell per day |
| photoRate_cellDensity_pmolC | Unit conversion to give photosynthetic rate in pmol units. | picomoles per cell per day |
| calcRate_cellDensity_ugC | C24 corrected to the cell density of the replicate to give a per cell calcification rate. | micrograms per cell per day |
| calcRate_cellDensity_pmolC | Unit conversion to give calcification rate in pmol units. | picomoles per cell per day |
| POC_ratio | Calculation of the particulate inorganic (PIC) to particulate organic (POC) ratio of P. carterae. | dimensionless |
| photoRate_mean | Mean of the photosynthetic rate. Three replicates per mean. | picomoles per cell per day |
| photoRate_SD | Standard deviation of the photosynthetic rate. Three replicates per standard deviation. | picomoles per cell per day |
| calcRate_mean | Mean of the calcification rate. Three replicates per mean. | picomoles per cell per day |
| calcRate_SD | Standard deviation of the calcification rate. Three replicates per standard deviation. | picomoles per cell per day |
| POC_ratio_mean | Mean of PIC to POC ratio. Three replicates per mean. | dimensionless |
| POC_ratio_SD | Standard deviation of the PIC to POC ratio. Three replicates per standard deviation. | dimensionless |
| Dataset-specific Instrument Name | Moxi Z Mini Automated Cell Counter |
| Generic Instrument Name | Automated Cell Counter |
| Dataset-specific Description | measures culture density |
| Generic Instrument Description | An instrument that determines the numbers, types or viability of cells present in a sample. |
| Dataset-specific Instrument Name | Puregas VCD CO2 Adsorber |
| Generic Instrument Name | CO2 Adsorber |
| Dataset-specific Description | instrument stripped compressed air of CO2 |
| Generic Instrument Description | CO2 Adsorber - an instrument designed to remove CO2 and moisture from compressed air. |
| Dataset-specific Instrument Name | Packard Tri-Carb 2750 LL |
| Generic Instrument Name | Liquid Scintillation Counter |
| Dataset-specific Description | measures radioactivity |
| Generic Instrument Description | Liquid scintillation counting is an analytical technique which is defined by the incorporation of the radiolabeled analyte into uniform distribution with a liquid chemical medium capable of converting the kinetic energy of nuclear emissions into light energy. Although the liquid scintillation counter is a sophisticated laboratory counting system used to quantify the activity of particulate emitting (ß and a) radioactive samples, it can also detect the auger electrons emitted from 51Cr and 125I samples.
Liquid scintillation counters are instruments assaying alpha and beta radiation by quantitative detection of visible light produced by the passage of rays or particles through a suitable scintillant incorporated into the sample. |
| Dataset-specific Instrument Name | Aalborg Mass Flow Controller |
| Generic Instrument Name | Mass Flow Controller |
| Dataset-specific Description | Indicate and control set flow rates of gases. Manufactured in Orangeburg, NY USA. |
| Generic Instrument Description | Mass Flow Controller (MFC) - A device used to measure and control the flow of fluids and gases |
Effects of ocean acidification on Emiliania huxleyi and Calanus finmarchicus; insights into the oceanic alkalinity and biological carbon pumps (OA_Copes_Coccoliths)
(Extracted from the NSF award abstract)
Ocean acidification is one of the most pressing marine science issues of our time, with potential biological impacts spanning all marine phyla and potential societal impacts affecting man's relationship to the sea. Rising levels of atmospheric pCO2 are increasing the acidity of the world oceans. It is generally held that average surface ocean pH has already declined by 0.1 pH units relative to the pre-industrial level (Orr et al., 2005), and is projected to decrease 0.3 to 0.46 units by the end of this century, depending on CO2 emission scenarios (Caldeira and Wickett, 2005). The overall goal of this research is to parameterize how changes in pCO2 levels could alter the biological and alkalinity pumps of the world ocean. Specifically, the direct and indirect effects of ocean acidification will be examined within a simple, controlled predator/prey system containing a single prey phytoplankton species (the coccolithophore, Emiliania huxleyi) and a single predator (the oceanic metazoan grazer, Calanus finmarchicus). The experiments are designed to elucidate both direct effects (i.e. effects of ocean acidification on the individual organisms only) and interactive effects (i.e. effects on the combined predator/prey system). Interactive experiments with phytoplankton prey and zooplankton predator are a critical starting point for predicting the overall impact of ocean acidification in marine ecosystems. To meet these goals, a state-of-the-art facility will be constructed with growth chambers that are calibrated and have highly-controlled pH and alkalinity levels. The strength of this approach lies in meticulous calibration and redundant measurements that will be made to ensure that conditions within the chambers are well described and tightly monitored for DIC levels. Growth and calcification rates in coccolithophores and the developmental rates, morphological and behavioral effects on copepods will be measured. The PIC and POC in the algae and the excreted fecal pellets will be monitored for changes in the PIC/POC ratio, a key parameter for modeling feedback mechanisms for rising pCO2 levels. In addition, 14C experiments are planned to measure calcification rates in coccolithophores and dissolution rates as a result of grazing. These key experiments will verify closure in the mass balance of PIC, allowing the determination of actual dissolution rates of PIC within the guts of copepod grazers.
Science, Engineering and Education for Sustainability NSF-Wide Investment (SEES): Ocean Acidification (formerly CRI-OA) (SEES-OA)
NSF Climate Research Investment (CRI) activities that were initiated in 2010 are now included under Science, Engineering and Education for Sustainability NSF-Wide Investment (SEES). SEES is a portfolio of activities that highlights NSF's unique role in helping society address the challenge(s) of achieving sustainability. Detailed information about the SEES program is available from NSF (https://www.nsf.gov/funding/pgm_summ.jsp?pims_id=504707).
In recognition of the need for basic research concerning the nature, extent and impact of ocean acidification on oceanic environments in the past, present and future, the goal of the SEES: OA program is to understand (a) the chemistry and physical chemistry of ocean acidification; (b) how ocean acidification interacts with processes at the organismal level; and (c) how the earth system history informs our understanding of the effects of ocean acidification on the present day and future ocean.
Solicitations issued under this program:
NSF 10-530, FY 2010-FY2011
NSF 12-500, FY 2012
NSF 12-600, FY 2013
NSF 13-586, FY 2014
NSF 13-586 was the final solicitation that will be released for this program.
PI Meetings:
1st U.S. Ocean Acidification PI Meeting(March 22-24, 2011, Woods Hole, MA)
2nd U.S. Ocean Acidification PI Meeting(Sept. 18-20, 2013, Washington, DC)
3rd U.S. Ocean Acidification PI Meeting (June 9-11, 2015, Woods Hole, MA – Tentative)
NSF media releases for the Ocean Acidification Program:
Press Release 10-186 NSF Awards Grants to Study Effects of Ocean Acidification
Discovery Blue Mussels "Hang On" Along Rocky Shores: For How Long?
Press Release 13-102 World Oceans Month Brings Mixed News for Oysters
| Funding Source | Award |
|---|---|
| NSF Division of Ocean Sciences (NSF OCE) |
[ table of contents | back to top ]