Dissolved iron speciation from 2013 U.S. GEOTRACES Eastern Pacific Zonal Transect from R/V Thomas G. Thompson TN303 from October-December 2013 (U.S. GEOTRACES EPZT project, EPZT Fe Cu Co project)
Project
Program
| Contributors | Affiliation | Role |
|---|---|---|
| Buck, Kristen Nicolle | University of South Florida (USF) | Principal Investigator |
| Copley, Nancy | Woods Hole Oceanographic Institution (WHOI BCO-DMO) | BCO-DMO Data Manager |
Dissolved iron-binding organic ligand concentrations and conditional stability constants from surface GeoFish and GO-FLO water column samples collected in 2013 during the U.S. GEOTRACES GP16 cruise in the Eastern Pacific between Peru and Tahiti on the R.V. Thomas G. Thompson, cruise TN303.
The FISH and BOTTLE data have been split into separate columns as per GEOTRACES Parameter Naming Conventions.The FISH data are to the far right.
* To access the data with the FISH and BOTTLE data merged, see: http://data.bco-dmo.org/jg/serv/BCO/GEOTRACES/EPZT/Fe_spec_EPZT_joined.html0%7Bdir=data.bco-dmo.org/jg/dir/BCO/GEOTRACES/EPZT/,info=data.bco-dmo.org/jg/info/BCO/GEOTRACES/EPZT/Fe_speciation%7D
Sample collection and filtering: Water column samples were collected by the U.S. GEOTRACES sampling team from 24 modified 12-L Teflon-coated GO-FLO samplers (General Oceanics) deployed on the GEOTRACES clean CTD rosette system (Cutter and Bruland 2012). The U.S. GEOTRACES sampling team filtered the samples through 0.2 µm Supor Acropak filter cartridges (Pall) inside the U.S. GEOTRACES clean-air laboratory van. Near-surface samples (~2 m depth) were collected underway either on approach or leaving each station using the Ken Bruland lab towfish, “GeoFish”, deployed to collect surface samples from outside the wake of the ship. Seawater from the GeoFish was pumped directly into the Bruland lab clean air laboratory van and filtered through 0.2 µm Supor Acropak filter cartridges.
Filtered seawater samples for iron speciation (organic complexation) were collected in 500 mL acid-cleaned Nalgene narrow-mouth fluorinated high-density polyethylene (FPE) bottles that had been filled with Milli-Q for at least two weeks after acid cleaning and rinsed three times with filtered seawater prior to sample collection (Buck et al. 2012). All filtered seawater samples for dissolved iron speciation were frozen at -20 ºC shipboard by the sampling team and shipped to the University of South Florida for laboratory-based analyses post cruise.
Dissolved iron speciation (organic complexation) analyses: Dissolved iron speciation (organic complexation) was analyzed using competitive ligand exchange- adsorptive cathodic stripping voltammetry (CLE-AdCSV) with salicylaldoxime as the added competing ligand (Buck et al. 2015), modified from the original Rue and Bruland (1995) method. A borate-ammonium buffer was added to all vials, for a final pH of 8.2 (NBS scale; Buck et al. 2007, 2012). Dissolved iron additions of 0 to 10 nM were used in the titrations, for a total of at least 15 points in each titration. These dissolved iron additions were chosen to match those of the U.S. GEOTRACES North Atlantic dataset and include additional datapoints within this range to allow higher resolution data within titrations (Buck et al. 2016). Deposition times of 90 to 600 s were applied to the analyses, with typically longer deposition times for deeper water column samples. CLE-AdCSV analyses were performed on Bioanalytical Systems (BASi) Controlled Growth Mercury Electrodes (static mercury drop setting, size 14) with Epsilon e2 (BASi) electrochemical analyzers. There are no reference samples available for iron speciation measurements of iron in seawater, though this method has been shown to compare well with other labs and techniques in GEOTRACES intercalibration exercises (Buck et al. 2012, 2016).
FLAG: The standard Ocean Data View qualifying flags were used (reference all flags at https://www.bodc.ac.uk/data/codes_and_formats/odv_format/):
1: Good Value: Good quality data value that is not part of any identified malfunction and has been verified as consistent with real phenomena during the quality control process. [Used when data were shown to be reproducible]
2: Probably Good Value: Data value that is probably consistent with real phenomena but this is unconfirmed or data value forming part of a malfunction that is considered too small to affect the overall quality of the data object of which it is a part. [Used when the reported value reflects analysis of a single or unverified replicate]
3: Probably Bad Value: Data value recognized as unusual during quality control that forms part of a feature that is probably inconsistent with real phenomena. [Not used]
4: Bad Value: An obviously erroneous data value. [Not used]
5: Changed Value: Data value adjusted during quality control. [Not used]
6: Value Below Detection Limit: The level of the measured phenomenon was too small to be quantified by the technique employed to measure it. The accompanying value is the detection limit for the technique or zero if that value is unknown. [We report “not_detected” rather than zero or a detection limit value for this case]
7: Value in Excess: The level of the measured phenomenon was too large to be quantified by the technique employed to measure it. The accompanying value is the measurement limit for the technique. [Not used]
8: Interpolated Value: This value has been derived by interpolation from other values in the data object. [Not used]
9: Missing Value: The data value is missing. Any accompanying value will be a magic number representing absent data. [Not used]
CLE-AdCSV data was interpreted using a freely available interpretation program, ProMCC (Omanovic et al. 2015; https://sites.google.com/site/mccprosece), which employs matrix based optimization of titration data fitting to obtain ligand concentrations and conditional stability constants for each sample. Uncertainties in the fitted parameter are presented as the 95% confidence interval provided by the interpretation program. When replicate titrations were conducted, results were presented as averages of the replicates.
Dissolved iron (DFe) concentrations determined by inductively coupled plasma-mass spectrometry (ICP-MS) in Peter Sedwick’s lab at Old Dominion University were used in the ProMCC interpretation program to calculate ligand concentrations and conditional stability constants from the sample titrations. The DFe values used for this dataset are provided in the speciation submission for reference, please see Sedwick’s EPZT dataset for the complete dissolved iron data and metadata.
The detection limit for the electroactive Fe-SA complex has been found to be 0.01 nM (Buck et al. 2007), calculated as three times the standard deviation of measured peak height from a 0.05 nM Fe addition to UV-oxidized and chelexed seawater with a 900 s deposition time. For a 90 s deposition time, the detection limit for Fe-SA is ~0.1 nM. In the U.S. GEOTRACES North Atlantic dataset using the same analytical techniques, samples from two stations were analyzed in triplicate complete titrations, typically two conducted shipboard and one in the laboratory after storing frozen (-20 ºC). Over the full water column from both stations, the average standard deviation from the triplicate titrations of each sample was 0.11 nM (n = 36 samples, 108 titrations), and three times this standard deviation estimates a detection limit for ligand concentrations of 0.33 nM. For log K1 values of this ligand class, from the same profiles, the average standard deviation was 0.15 (log units).
Related files and references:
Buck, K. N., L. J. A. Gerringa, and M. J. A. Rijkenberg. 2016. An intercomparison of dissolved iron speciation at the Bermuda Atlantic Time-series Station (BATS): Results from the GEOTRACES Crossover Station A. Frontiers in Marine Biogeochemistry 3: article 262.
Buck, K. N., M. C. Lohan, C. J. M. Berger, and K. W. Bruland. 2007. Dissolved iron speciation in two distinct river plumes and an estuary: Implications for riverine iron supply. Limnology and Oceanography 52: 843-855.
Buck, K. N., J. W. Moffett, K. A. Barbeau, R. M. Bundy, Y. Kondo, and J. Wu. 2012. The organic complexation of iron and copper: an intercomparison of competitive ligand exchange- adsorptive cathodic stripping voltammetry (CLE-ACSV) techniques. Limnology and Oceanography: Methods 10: 496-515.
Buck, K. N., B. Sohst, and P. N. Sedwick. 2015. The organic complexation of dissolved iron along the U.S. GEOTRACES (GA03) North Atlantic Section. Deep-Sea Research 116: 152-165.
Cutter, G., P. Andersson, L. Codispoti, P. Croot, R. Francois, M. Lohan, H. Obata, and M. Rutgers van der Loeff [eds.]. 2010. Sampling and sample-handling protocols for GEOTRACES cruises version 1.0 ed. GEOTRACES.
Cutter, G. A., and K. W. Bruland. 2012. Rapid and noncontaminating sampling system for trace elements in global ocean surveys. Limnology and Oceanography: Methods 10: 425-436.
Omanović, D., C. Garnier, and I. Pižeta. 2015. ProMCC: An all-in-one tool for trace metal complexation studies. Marine Chemistry 173: 25-39.
Rue, E. L., and K. W. Bruland. 1995. Complexation of iron(III) by natural organic ligands in the Central North Pacific as determined by a new competitive ligand equilibration adsorptive cathodic stripping voltammetric method. Marine Chemistry 50: 117-138.
BCO-DMO Processing Notes:
- added conventional header with dataset name, PI name, version date
- column names reformatted to comply with BCO-DMO standards
- replaced 1 blank cell with nd, 'no data'
- joined with the master file to get columns: GEOTRC_EVENTNO, GEOTRC_INSTR, ISO_DATETIME_UTC_START_EVENT
Additional GEOTRACES Processing
As was done for the GEOTRACES-NAT data, BCO-DMO added standard US GEOTRACES information, such as the US GEOTRACES event number, to each submitted dataset lacking this information. To accomplish this, BCO-DMO compiled a 'master' dataset composed of the following parameters:
cruise_id, EXPOCODE,SECT_ID, STNNBR, CASTNO, GEOTRC_EVENTNO, GEOTRC_SAMPNO, GEOTRC_INSTR, SAMPNO, GF_NO, BTLNBR, BTLNBR_FLAG_W, DATE_START_EVENT, TIME_START_EVENT, ISO_DATETIME_UTC_START_EVENT, EVENT_LAT, EVENT_LON, DEPTH_MIN, DEPTH_MAX, BTL_DATE, BTL_TIME, BTL_ISO_DATETIME_UTC, BTL_LAT, BTL_LON, ODF_CTDPRS, SMDEPTH, FMDEPTH, BTMDEPTH, CTDPRS, CTDDEPTH.
This added information will facilitate subsequent analysis and inter comparison of the datasets.
Bottle parameters in the master file were taken from the GT-C_Bottle and ODF_Bottle datasets. Non-bottle parameters, including those from GeoFish tows, Aerosol sampling, and McLane Pumps, were taken from the TN303 Event Log (version 30 Oct 2014). Where applicable, pump information was taken from the PUMP_Nuts_Sals dataset.
A standardized BCO-DMO method (called "join") was then used to merge the missing parameters to each US GEOTRACES dataset, most often by matching on GEOTRC_SAMPNO or on some unique combination of other parameters.
If the master parameters were included in the original data file and the values did not differ from the master file, the original data columns were retained and the names of the parameters were changed from the PI-submitted names to the standardized master names. If there were differences between the PI-supplied parameter values and those in the master file, both columns were retained. If the original data submission included all of the master parameters, no additional columns were added, but parameter names were modified to match the naming conventions of the master file.
See the dataset parameters documentation for a description of which parameters were supplied by the PI and which were added via the join method.
| File |
|---|
Fe_spec_EPZT_joined_fish_btl.csv (Comma Separated Values (.csv), 152.79 KB) MD5:f19b059594f2030de0d42f6d42b785f4 Primary data file for dataset ID 668556 |
| Parameter | Description | Units |
| cruise_id | cruise identification | unitless |
| station | station number | unitless |
| GEOTRC_SAMPNO | Unique identifying number for US GEOTRACES samples. PI-supplied values were identical to those in the intermediate US GEOTRACES EPZT master file | unitless |
| GEOTRC_EVENTNO | Unique identifying number for US GEOTRACES sampling event. Added by BCO-DMO from the intermediate US GEOTRACES EPZT master file. | unitless |
| GEOTRC_INSTR | Unique identifying number for US GEOTRACES instruments. Added by BCO-DMO from the intermediate US GEOTRACES EPZT master file. | unitless |
| ISO_DATETIME_UTC_START_EVENT | Event start date/time (UTC) formatted to ISO8601 standard. T indicates start of time string; Z indicates UTC. Calculated from original date and time fields. Values were added from the intermediate US GEOTRACES EPZT master file (see Processing Description). Formatted as YYYY-mm-ddTHH:MM:SS.ssZ | year-month-day-hour-minute-second |
| date | GMT date when rosette cast was started; formatted as yyyymmdd | year-month-day |
| lat | Station latitude; north is positive: position when sampling cast was started (2 m sample = underway sample collected typically on approach to station) | decimal degrees |
| lon | Station longitude; east is positive; position when sampling cast was started (2 m sample = underway sample collected typically on approach to station) | decimal degrees |
| depth | sample collection depth below sea surface | meters |
| Fe_D_CONC_BOTTLE | Dissolved iron (Fe) concentration value from bottle samples used in the speciation data interpretation. Data received from Mak Saito’s lab at Woods Hole Oceanography Institution; contact Saito for additional information. Units | nanomoles/liter (10^-9 M) |
| L1Fe_D_CONC_BOTTLE | concentration of dissolved iron-binding ligand from bottle samples with log K1 >= 12. "not_detected" used when this parameter was not determined in sample analyses. | nanomoles/liter (10^-9 M) |
| L1_FLAG | L1 quality flag | unitless |
| L1Fe_D_LogK_BOTTLE | log conditional stability constant from bottle samples of L1 complexes with iron (logK^cond FeL1.Fe'). "not_detected" used when this parameter was not determined in sample analyses. | No units; K1 has units of M-1 |
| log_K1_FLAG | K1 quality flag | unitless |
| log_K1_95pcnt_CI | 95% confidence limit of log K1 determined from data fit by ProMCC. "nd = no data" used when maximum value of 13 assigned due to ProMCC returning values > 13 and large 95% CI indicating results outside of analytical window. | No units; K1 has units of M-1 |
| L2Fe_D_CONC_BOTTLE | concentration of dissolved iron-binding ligand with log K2 = 11-12 from bottle samples. "not_detected" used when this parameter was not determined in sample analyses. | nanomoles/liter (10^-9 M) |
| L2_FLAG | L2 quality flag | unitless |
| L2_95pcnt_CI | 95% confidence limit of [L2] determined from data fit by ProMCC. Units "nd" = "not detected". | nanomoles/liter (10^-9 M) |
| L2Fe_D_LogK_BOTTLE | log conditional stability constant of L2 complexes with iron (logK^cond FeL2.Fe') from bottle samples. "not_detected" used when this parameter was not determined in sample analyses. | No units; K2 has units of M^-1 |
| log_K2_FLAG | K2 quality flag | unitless |
| log_K2_95pcnt_CI | 95% confidence limit of log K2 determined from data fit by ProMCC. "nd" = "not detected". | No units; K2 has units of M^-1 |
| L3Fe_D_CONC_BOTTLE | concentration of dissolved iron-binding ligand with log K3 = 10-11 from bottle samples. "not_detected" used when this parameter was not determined in sample analyses. | nanomoles/liter (10^-9 M) |
| L3_FLAG | L3 quality flag | unitless |
| L3_95pcnt_CI | 95% confidence limit of [L3] determined from data fit by ProMCC. Units "nd" = "not detected". | nanomoles/liter (10^-9 M) |
| L3Fe_D_LogK_BOTTLE | log conditional stability constant of L3 complexes with iron (logK^cond FeL3.Fe') from bottle samples. "not_detected" used when this parameter was not determined in sample analyses. | No units; K3 has units of M^-1 |
| log_K3_FLAG | K3 quality flag | unitless |
| log_K3_95pcnt_CI | 95% confidence limit of log K3 determined from data fit by ProMCC. "nd" = "not detected". | No units; K3 has units of M^-1 |
| Fe_D_CONC_FISH | Dissolved iron (Fe) concentration value used in the speciation data interpretation; from Fish samples. Data received from Mak Saito’s lab at Woods Hole Oceanography Institution; contact Saito for additional information. Units | nanomoles/liter (10^-9 M) |
| L1Fe_D_CONC_FISH | concentration of dissolved iron-binding ligand with log K1 = 12; from Fish samples. "not_detected" used when this parameter was not determined in sample analyses. | nanomoles/liter (10^-9 M) |
| L1_FLAG_FISH | L1 quality flag | unitless |
| L1Fe_D_LogK_FISH | log conditional stability constant of L1 complexes with iron (logK^cond FeL1.Fe'); from Fish samples. "not_detected" used when this parameter was not determined in sample analyses. | No units; K1 has units of M-1 |
| log_K1_FLAG_FISH | K1 quality flag | unitless |
| log_K1_95pcnt_CI_FISH | 95% confidence limit of log K1 determined from data fit by ProMCC. "nd = no data" used when maximum value of 13 assigned due to ProMCC returning values > 13 and large 95% CI indicating results outside of analytical window. | No units; K1 has units of M-1 |
| L2Fe_D_CONC_FISH | concentration of dissolved iron-binding ligand with log K2 = 11-12; from Fish samples. "not_detected" used when this parameter was not determined in sample analyses. | nanomoles/liter (10^-9 M) |
| L2_FLAG_FISH | L2 quality flag | unitless |
| L2_95pcnt_CI_FISH | 95% confidence limit of [L2] determined from data fit by ProMCC. Units "nd" = "not detected". | nanomoles/liter (10^-9 M) |
| L2Fe_D_LogK_FISH | log conditional stability constant of L2 complexes with iron (logK^cond FeL2.Fe'); from Fish samples. "not_detected" used when this parameter was not determined in sample analyses. | No units; K2 has units of M^-1 |
| log_K2_FLAG_FISH | K2 quality flag | unitless |
| log_K2_95pcnt_CI_FISH | 95% confidence limit of log K2 determined from data fit by ProMCC. "nd" = "not detected". | No units; K2 has units of M^-1 |
| L3Fe_D_CONC_FISH | concentration of dissolved iron-binding ligand with log K3 = 10-11; from Fish samples. "not_detected" used when this parameter was not determined in sample analyses. | nanomoles/liter (10^-9 M) |
| L3_FLAG_FISH | L3 quality flag | unitless |
| L3_95pcnt_CI_FISH | 95% confidence limit of [L3] determined from data fit by ProMCC. Units "nd" = "not detected". | nanomoles/liter (10^-9 M) |
| L3Fe_D_LogK_FISH | log conditional stability constant of L3 complexes with iron (logK^cond FeL3.Fe'); from Fish samples. "not_detected" used when this parameter was not determined in sample analyses. | No units; K3 has units of M^-1 |
| log_K3_FLAG_FISH | K3 quality flag | unitless |
| log_K3_95pcnt_CI_FISH | 95% confidence limit of log K3 determined from data fit by ProMCC. "nd" = "not detected". | No units; K3 has units of M^-1 |
| L1_95pcnt_CI | 95% confidence limit of [L1] determined from data fit by ProMCC. Units "nd" = "not detected". | nanomoles/liter (10^-9 M) |
| L1_95pcnt_CI_FISH | 95% confidence limit of [L1] determined from data fit by ProMCC. Units "nd" = "not detected". | nanomoles/liter (10^-9 M) |
| Dataset-specific Instrument Name | BASi Controlled Growth Mercury Electrode |
| Generic Instrument Name | BASi Controlled Growth Mercury Electrode |
| Dataset-specific Description | For CLE-AdCSV analyses |
| Generic Instrument Description | Bioanalytical Systems (BASi) Mercury drop electrodes are generated by the BASi Controlled Growth Mercury Electrode (CGME) in three modes:
DME (Dropping Mercury Electrode) - mercury is allowed to flow freely from the reservoir down the capillary and so the growth of the mercury drop and its lifetime is controlled by gravity. (The optional 100 um capillary is recommended for this mode.)
SMDE (Static Mercury Drop Electrode) - the drop size is determined by the length of time for which the fast-response capillary valve is opened, and the drop is dislodged by a drop knocker. The dispense/knock timing is microprocessor-controlled and is typically coordinated with the potential pulse or square-wave waveform. This mode can also used to generate the Hanging Mercury Drop Electrode required for stripping experiments.
CGME (Controlled Growth Mercury Electrode) - the mercury drop is grown by a series of pulses that open the capillary valve. The number of pulses, their duration, and their frequency can be varied by PC control, providing great flexibility in both the drop size and its rate of growth. This CGME mode can be used for both polarographic and stripping experiments.
http://www.basinc.com/products/ec/cgme.php |
| Dataset-specific Instrument Name | BASi EC-epsilon 2 Autoanalyzer |
| Generic Instrument Name | BASi EC-epsilon 2 Autoanalyzer |
| Dataset-specific Description | For CLE-AdCSV analyses |
| Generic Instrument Description | The Bioanalytical Systems EC epsilon is a family of potentiostat/galvanostats for electrochemistry. The most basic epsilon instrument can be used for standard techniques, as well as chronopotentiometry for materials characterization (e.g., characterization of transition metal complexes by cyclic voltammetry and controlled potential electrolysis, or of biosensors by cyclic voltammetry and constant potential amperometry). Pulse, square wave, and stripping techniques can be added by a software upgrade, and a second channel can be added by a hardware upgrade. |
| Dataset-specific Instrument Name | |
| Generic Instrument Name | CTD Sea-Bird |
| Generic Instrument Description | A Conductivity, Temperature, Depth (CTD) sensor package from SeaBird Electronics. This instrument designation is used when specific make and model are not known or when a more specific term is not available in the BCO-DMO vocabulary. Refer to the dataset-specific metadata for more information about the specific CTD used. More information from: http://www.seabird.com/ |
| Dataset-specific Instrument Name | |
| Generic Instrument Name | GeoFish Towed near-Surface Sampler |
| Generic Instrument Description | The GeoFish towed sampler is a custom designed near surface (2 meters or less) sampling system for the collection of trace metal clean seawater. It consists of a PVC encapsulated lead weighted torpedo and separate PVC depressor vane supporting the intake utilizing all PFA Teflon tubing connected to a deck mounted, air-driven, PFA Teflon dual-diaphragm pump which provides trace-metal clean seawater at up to 3.7L/min. The GeoFish is towed at up to 13kts off to the side of the vessel outside of the ship's wake to avoid possible contamination from the ship's hull. It was developed by Geoffrey Smith and Ken Bruland (University of California, Santa Cruz). |
| Dataset-specific Instrument Name | 24 modified 12-L Teflon-coated GO-FLO samplers (General Oceanics) |
| Generic Instrument Name | GO-FLO Teflon Trace Metal Bottle |
| Dataset-specific Description | Used for water sample collections |
| Generic Instrument Description | GO-FLO Teflon-lined Trace Metal free sampling bottles are used for collecting water samples for trace metal, nutrient and pigment analysis. The GO-FLO sampling bottle is designed specifically to avoid sample contamination at the surface, internal spring contamination, loss of sample on deck (internal seals), and exchange of water from different depths. |
TN303
| Website | |
| Platform | R/V Thomas G. Thompson |
| Report | |
| Start Date | 2013-10-25 |
| End Date | 2013-12-20 |
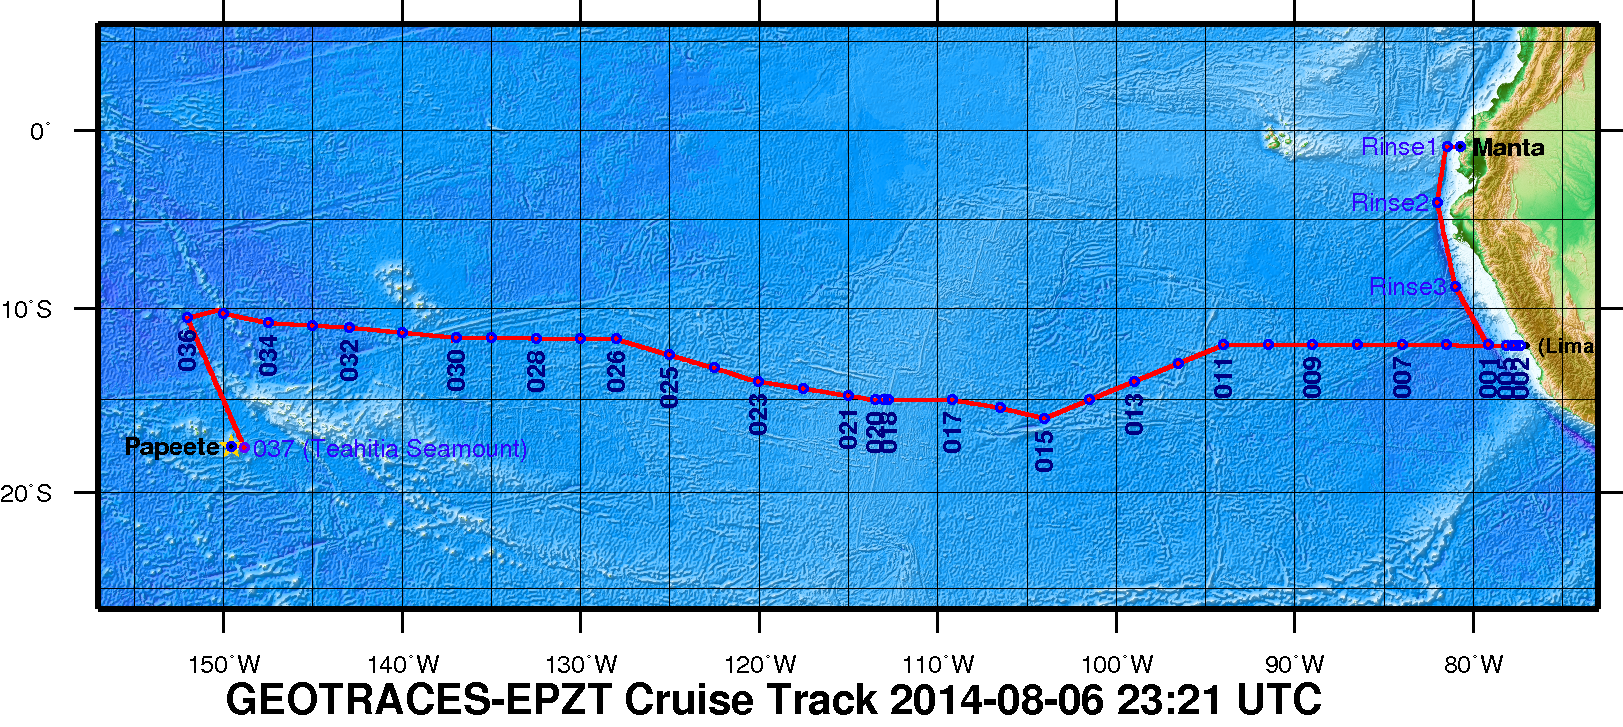
| Description | A zonal transect in the eastern tropical South Pacific (ETSP) from Peru to Tahiti as the second cruise of the U.S.GEOTRACES Program. This Pacific section includes a large area characterized by high rates of primary production and particle export in the eastern boundary associated with the Peru Upwelling, a large oxygen minimum zone that is a major global sink for fixed nitrogen, and a large hydrothermal plume arising from the East Pacific Rise. This particular section was selected as a result of open planning workshops in 2007 and 2008, with a final recommendation made by the U.S.GEOTRACES Steering Committee in 2009. It is the first part of a two-stage plan that will include a meridional section of the Pacific from Tahiti to Alaska as a subsequent expedition.
Figure 1. The 2013 GEOTRACES EPZT Cruise Track. [click on the image to view a larger version]
Additional cruise information is available from the Rolling Deck to Repository (R2R): http://www.rvdata.us/catalog/TN303 |
U.S. GEOTRACES East Pacific Zonal Transect (GP16) (U.S. GEOTRACES EPZT)
From the NSF Award Abstract
The mission of the International GEOTRACES Program (https://www.geotraces.org/), of which the U.S. chemical oceanography research community is a founding member, is "to identify processes and quantify fluxes that control the distributions of key trace elements and isotopes in the ocean, and to establish the sensitivity of these distributions to changing environmental conditions" (GEOTRACES Science Plan, 2006). In the United States, ocean chemists are currently in the process of organizing a zonal transect in the eastern tropical South Pacific (ETSP) from Peru to Tahiti as the second cruise of the U.S.GEOTRACES Program. This Pacific section includes a large area characterized by high rates of primary production and particle export in the eastern boundary associated with the Peru Upwelling, a large oxygen minimum zone that is a major global sink for fixed nitrogen, and a large hydrothermal plume arising from the East Pacific Rise. This particular section was selected as a result of open planning workshops in 2007 and 2008, with a final recommendation made by the U.S.GEOTRACES Steering Committee in 2009. It is the first part of a two-stage plan that will include a meridional section of the Pacific from Tahiti to Alaska as a subsequent expedition.
This award provides funding for management of the U.S.GEOTRACES Pacific campaign to a team of scientists from the University of Southern California, Old Dominion University, and the Woods Hole Oceanographic Institution. The three co-leaders will provide mission leadership, essential support services, and management structure for acquiring the trace elements and isotopes samples listed as core parameters in the International GEOTRACES Science Plan, plus hydrographic and nutrient data needed by participating investigators. With this support from NSF, the management team will (1) plan and coordinate the 52-day Pacific research cruise described above; (2) obtain representative samples for a wide variety of trace metals of interest using conventional CTD/rosette and GEOTRACES Sampling Systems; (3) acquire conventional JGOFS/WOCE-quality hydrographic data (CTD, transmissometer, fluorometer, oxygen sensor, etc) along with discrete samples for salinity, dissolved oxygen (to 1 uM detection limits), plant pigments, redox tracers such as ammonium and nitrite, and dissolved nutrients at micro- and nanomolar levels; (4) ensure that proper QA/QC protocols are followed and reported, as well as fulfilling all GEOTRACES Intercalibration protocols; (5) prepare and deliver all hydrographic-type data to the GEOTRACES Data Center (and US data centers); and (6) coordinate cruise communications between all participating investigators, including preparation of a hydrographic report/publication.
Broader Impacts: The project is part of an international collaborative program that has forged strong partnerships in the intercalibration and implementation phases that are unprecedented in chemical oceanography. The science product of these collective missions will enhance our ability to understand how to interpret the chemical composition of the ocean, and interpret how climate change will affect ocean chemistry. Partnerships include contributions to the infrastructure of developing nations with overlapping interests in the study area, in this case Peru. There is a strong educational component to the program, with many Ph.D. students carrying out thesis research within the program.
Figure 1. The 2013 GEOTRACES EPZT Cruise Track. [click on the image to view a larger version]
US GEOTRACES Pacific Section: Measurement of the organic complexation of dissolved iron, copper and cobalt, and total dissolved cobalt (EPZT Fe Cu Co)
Description from NSF award abstract:
Dissolved iron (Fe), copper (Cu), and cobalt (Co) are essential elements for phytoplankton growth which in turn influences the marine carbon cycle; however, despite this important role, the cycling, distribution, and bioavailability of these bioactive elements remains poorly understood. For example, strong organic ligands influence bioavailability and solubility, but it is unclear how interactions change throughout the water column under variable conditions. Recognizing a need for this data, researchers from the Bermuda Institute of Ocean Sciences, Woods Hole Oceanographic Institution, and Scripps Institute of Oceanography will measure the organic complexation of dissolved Fe, Cu, and Co as well as total dissolved Co concentrations during the 2013 GEOTRACES cruise which will transect the coastal upwelling zone off Peru, an intense oxygen minimum zone, the East Pacific Rise hydrothermal plume, and the oligotrophic waters near Tahiti. This study will result in a significant dataset on the speciation of these bioactive elements throughout the water column which will help assess the relationships between dissolved Fe, Cu, and Co distributions and ligand concentration gradients and will likely reveal large chemical gradients over this dynamic oceanographic region. As regards dissolved Co concentrations, these measurements should provide new insights on the marine biogeochemistry of the element, especially in relation to oxygen minimum zones and hydrothermal plumes.
U.S. GEOTRACES (U.S. GEOTRACES)
GEOTRACES is a SCOR sponsored program; and funding for program infrastructure development is provided by the U.S. National Science Foundation.
GEOTRACES gained momentum following a special symposium, S02: Biogeochemical cycling of trace elements and isotopes in the ocean and applications to constrain contemporary marine processes (GEOSECS II), at a 2003 Goldschmidt meeting convened in Japan. The GEOSECS II acronym referred to the Geochemical Ocean Section Studies To determine full water column distributions of selected trace elements and isotopes, including their concentration, chemical speciation, and physical form, along a sufficient number of sections in each ocean basin to establish the principal relationships between these distributions and with more traditional hydrographic parameters;
* To evaluate the sources, sinks, and internal cycling of these species and thereby characterize more completely the physical, chemical and biological processes regulating their distributions, and the sensitivity of these processes to global change; and
* To understand the processes that control the concentrations of geochemical species used for proxies of the past environment, both in the water column and in the substrates that reflect the water column.
GEOTRACES will be global in scope, consisting of ocean sections complemented by regional process studies. Sections and process studies will combine fieldwork, laboratory experiments and modelling. Beyond realizing the scientific objectives identified above, a natural outcome of this work will be to build a community of marine scientists who understand the processes regulating trace element cycles sufficiently well to exploit this knowledge reliably in future interdisciplinary studies.
Expand "Projects" below for information about and data resulting from individual US GEOTRACES research projects.
| Funding Source | Award |
|---|---|
| NSF Division of Ocean Sciences (NSF OCE) |
[ table of contents | back to top ]