Mass flux, organic carbon, organic nitrogen, and biogenic silica flux data from sediment traps in the Ross Sea, 2001-2006 (IVARS project)
Project
| Contributors | Affiliation | Role |
|---|---|---|
| Smith, Walker O. | Virginia Institute of Marine Science (VIMS) | Principal Investigator |
| Copley, Nancy | Woods Hole Oceanographic Institution (WHOI BCO-DMO) | BCO-DMO Data Manager |
Abstract
Moorings were deployed at two locations, named Callinectes and Xiphius. Deployments were in late December, and recovery in early February. Cup collection duration was 3 days. 2002-2003 moorings were lost and have no data. These data were published in Smith et al (2011).
Methodology from Smith et al (2011):
As a part of the Interannual Variability in the Antarctic-Ross Sea (IVARS) program, two McLane Mark 78-H PARFLUX time-series sediment traps were deployed on moorings during the austral summers of four years: 2001-2002, 2003-2004, 2004-2005, and 2005-2006. Moorings were deployed in late December (late spring) in ice-free waters and retrieved in early February (summer) using either the U.S.C.G.C Polar Star or the R.V.I.B. Nathaniel B. Palmer (Table 1 provides the deployment and recovery data) at 77°S, 172.7°W (Callinectes) and 77.8°S, 180° (Xiphius) in the southern Ross Sea (Fig. 1). Water depth for both moorings was approximately 600 m. The sediment traps were moored at 200 m, and each mooring had a long "S" tether to decouple the two sections of the mooring and to place the shallow sensors at relatively fixed depths relative to the surface (Fig. 2). All traps were baffled. Additionally, InterOcean Systems S-4 current meters were deployed 5 m above each trap, and current speeds and directions were binned and recorded every 5 min. Tidal signals were strong, and 12 h means calculated and analyzed. Each sediment trap cup collected for an equal time period based on the date of deployment and the anticipated date of recovery - between 2 and 3 d. Before deployment, each sample cup was filled with preservative solution that consisted of buffered 2% formalin and 50 g L-1 NaCl final concentration (Asper and Smith, 1999). Data from the near-surface instruments are reported elsewhere (Smith et al., 2010). In all trap deployments, the mechanisms performed properly; however, a few samples were lost due to damage in shipment and a misalignment of the starting position on the sample carousel for Callinectes in 2005-2006.
After recovery, the preserved samples were returned to the laboratory and filtered through a 600 µm mesh to remove all the zooplankton swimmers before splitting. The mesh was rinsed into a glass vial and any remaining organisms were removed. Next, each filtered sediment trap sample was split into four samples using a four-way plankton splitter, with aliquots collected for total mass flux (TMF), biogenic silica (BSi), particulate organic carbon and nitrogen (POC and PN), and fecal pellet microscopy. Total mass flux (dry weight) samples were filtered through pre-weighed 0.8 µm Poretics polycarbonate filters, rinsed with ammonium formate to remove seawater salts, dried (at 60 °C for approximately 4 d, until a constant weight was obtained), and reweighed. POC and PN samples were filtered through precombusted Whatman GF/F filters and rinsed with ca. 5 mL 0.01 N HCl in seawater to remove inorganic carbon. Filters were then placed in combusted glass vials, covered with combusted aluminum foil, and dried at 60 °C. Once dry, POC/PN samples were processed on a Carlo-Erba 1108 elemental analyzer using acetanilide as a standard (Asper and Smith, 1999). Biogenic silica (BSi) concentrations were determined by filtering samples through 0.6 µm Poretics polycarbonate filters, placing the filters in plastic petri dishes, and drying at 60 °C. Filters were digested and quantified spectrophotometrically (Brzezinski and Nelson, 1989). Total mass flux, organic carbon and nitrogen, and biogenic silica were converted to flux by
(1) F=M/TA
where F is the flux (in weight or molar units m-2 d-1), M is the variable in question, A is the area of the sediment trap opening (0.5 m2), and T is the time interval in days when each cup remained open.
Aliquots for microscopy were further split using a smaller two-way Folsom plankton splitter until approximately 100 fecal pellets per sample were left for enumeration. Samples were then concentrated onto a 53 µm sieve; minipellets (Accornero and Gowing, 2003) were not included in the microscopic analyses. The samples were placed in clean petri dishes and imaged using an Olympus stereo dissecting microscope. Images of fecal pellets for 4-5 samples of selected trap intervals in each year were analyzed using Image Pro software, from which the length and width of each individual pellet were measured. Observations, including morphology and color, were taken from ca. 4000 pellets. Fecal pellet carbon was measured using the volumes calculated from microscopy (Kelchner, 2005) and volume to carbon relationships from the literature. Fecal pellet carbon values were not available from the Ross Sea; therefore, the lowest literature value used for other polar studies (0.016 mg C mm-2, euphausiid pellets from the Scotia Sea; González, 1992) and a middle range value (0.05 mg C mm-2, copepod pellets from Norway; Wexels Riser et al., 2002) were used to delineate the error surrounding these measurements (Gowing et al., 2001). All weights were converted to molar units for comparison with particulate organic carbon fluxes.
To assess net community production and estimate export, we constructed elemental budgets of nitrogen and silica in a manner similar to that of Bates et al. (1998), Smith and Asper (2000) and Sweeney et al. (2000). Because two periods were sampled (at the deployment and recovery of moorings), the temporal dynamics of nutrient uptake could be more finely resolved than in previous studies and related more closely to assemblage composition. Properties of the water column were sampled upon deployment and recovery of the moorings. CTD casts were completed immediately after mooring deployment using a SeaBird 911+ CTD mounted on a rosette fitted with 10 L Bullister bottles. We sampled twelve depths in the upper 200 m, with at least 75% of these concentrated in the euphotic zone. Nutrient (NO3, NH4, PO4, and Si(OH)4) samples were collected, filtered through 0.4 µm Acrodisc filters, and frozen. All nutrient concentrations were determined using automated techniques in the laboratory (JGOFS, 1996). Particulate organic carbon/nitrogen and biogenic silica concentrations were determined from seawater samples of known volumes that had been filtered through combusted GFF filters or polycarbonate filters (0.6 µm Poretics) and analyzed as described above. Water column values were calculated using trapezoidal integrations.
Production of PON [delta(NO3-)] was estimated from the seasonal uptake of nitrate at each station by

where z is the depth, and the subscripts min and winter refer to the observed nitrate concentrations in the water column and the winter nutrient concentration, respectively. Nitrogen units were converted to carbon units using the measured molar C/N ratio of particulate matter (Smith et al., 2006); all integrations were from 0 to 200 m. An integration depth of 200 m was chosen because this is far below the depth of nutrient removal during austral summer, and flux to greater depths can be considered to be "lost" from the surface layer, on at least seasonal time scales. Diffusional inputs through the strong pycnocline are ignored, as is horizontal advection, which appears to generate rapid changes in parameters but with no net changes on a seasonal basis (Smith et al., 2010). Similarly, the production of biogenic silica [delta(Si(OH)4)] was estimated using
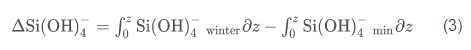
and converted to carbon units using the molar C/Si ratio (1.61) measured by Nelson and Smith (1986) for blooms in the Ross Sea overwhelmingly dominated by diatoms. There are no data to suggest that winter values of silicic acid and nitrate in the Ross Sea change on decadal or shorter time scales, and vertical mixing during winter and slow nutrient regeneration during the austral winter make nutrient concentrations nearly uniform throughout the water column (Gordon et al., 2000). Hence, winter nitrate and silicic acid concentrations can be reliably predicted from previously collected data (e.g., nitrate values=31.0 µM when normalized to S as 35 psu, and silicic acid values=80 µM; Smith and Asper, 2000; http://usjgofs.whoi.edu/jg/dir/jgofs/southern/). Nitrate potentially can be remineralized within the growing season via nitrification, but this process is extremely slow at the low temperatures of the Ross Sea and was ignored (Karl et al., 1996). Integrated NH4 concentrations are less than 5% of the total inorganic nitrogen concentrations at all times, and are also ignored for these calculations (Smith et al., 2006).
The export of particulate nitrogen and silicon was estimated by comparing the seasonal changes in their concentrations within the water column:
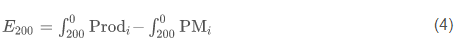
where E200 is the export from the upper 200 m, Prodi is the production of either N or Si at time i (estimated from Eqs. (2) and (3)), and PMi is the particulate nitrogen or silica concentration at time i. Particulate matter levels at the bloom's start are based on early spring measurements (http://usjgofs.whoi.edu/jg/dir/jgofs/southern/). We realize that for nitrogen some portion of the material may have entered the dissolved organic nitrogen (DON) pool, but we have no way to assess that pathway. All assumptions are discussed fully in Smith and Asper (2000) and Smith et al. (2006). Phosphate was not treated in this analysis due to a more limited particulate phosphorus data set.
BCO-DMO Processing Notes:
- added conventional header with dataset name, PI name, version date
- modified parameter names to conform with BCO-DMO naming conventions
- replaced spaces and / with underscores
- blank values replaced with no data value 'nd'
- revised the authors provided for the reference
| File |
|---|
sediment_trap.csv (Comma Separated Values (.csv), 13.64 KB) MD5:52c00a274c4d753b8cf2f9902b8bd01e Primary data file for dataset ID 710053 |
| Parameter | Description | Units |
| sample | sediment sample identifier | unitless |
| Latitude | latitude; north is positive | decimal degrees |
| Longitude | longitude; east is postivie | decimal degrees |
| Date | sampling date (UTC) | unitless |
| TMF | Total mass flux: weight of material collected in cup | milligrams/meter square/day (mg/m2/d ) |
| Bsi_flux | Biogenic silica flux: weight of silica collected in cup | milligrams/meter square/day (mg/m2/d ) |
| BSi_flux_TMF_pcent | Biogenic silica flux as percentage of TMF | dimensionless |
| OC_flux | Organic carbon flux: weight of org C collected in cup | milligrams/meter square/day (mg/m2/d ) |
| OC_flux_TMF_pcent | Organic carbon flux as percentage of TMF | dimensionless |
| N_flux | Organic nitrogen flux: weight of org N collected in cup | milligrams/meter square/day (mg/m2/d ) |
| N_flux_TMF_pcent | Organic nitrogen flux as percentage of TMF | dimensionless |
| Bsi_to_OC | Ratio of biogenic silica to organic carbon: BSi/OC | dimensionless |
| C_to_N | Ratio of organic carbon to nitrogen: OC/N | dimensionless |
| fecal_pellets | Fecal pellet contribution: weight of fecal pellets; derived microscopically from size | milligrams carbon/meter square/day (mg/m2/d ) |
| year | sampling year | unitless |
| season | sampling season | unitless |
| Dataset-specific Instrument Name | McLane Mark 78-H PARFLUX time-series sediment traps |
| Generic Instrument Name | Sediment Trap |
| Dataset-specific Description | bottom-mounted, taut line moorings; trap at 200 m |
| Generic Instrument Description | Sediment traps are specially designed containers deployed in the water column for periods of time to collect particles from the water column falling toward the sea floor. In general a sediment trap has a jar at the bottom to collect the sample and a broad funnel-shaped opening at the top with baffles to keep out very large objects and help prevent the funnel from clogging. This designation is used when the specific type of sediment trap was not specified by the contributing investigator. |
Ross_Sea_2001-2006_Smith
| Website | |
| Platform | Unknown Vessel |
| Start Date | 2001-12-24 |
| End Date | 2006-01-30 |
| Description | A series of cruises to the southern Ross Sea that used either the USCGC Polar Star, USCGC Polar Sea, or the N.B. Palmer. |
IVARS_cruises
| Website | |
| Platform | USCGC Polar Star |
| Start Date | 2001-12-20 |
| End Date | 2005-02-01 |
NBP0601A
| Website | |
| Platform | RVIB Nathaniel B. Palmer |
| Start Date | 2006-01-30 |
| End Date | 2006-02-02 |
| Description | IVARS cruise |
Interannual Variability in the Antarctic-Ross Sea (IVARS): Nutrients and Seasonal Production (IVARS)
NSF Award Abstract:
During the past few decades of oceanographic research, it has been recognized that significant variations in biogeochemical processes occur among years. Interannual variations in the Southern Ocean are known to occur in ice extent and concentration, in the composition of herbivore communities, and in bird and marine mammal distributions and reproductive success. However, little is known about the interannual variations in production of phytoplankton or the role that these variations play in the food web. This project will collect time series data on the seasonal production of phytoplankton in the southern Ross Sea, Antarctica. Furthermore, it will assess the interannual variations of the production of the two major functional groups of the system, diatoms and Phaeocystis Antarctica, a colonial haptophyte. The Ross Sea provides a unique setting for this type of investigation for a number of reasons. For example, a de facto time-series has already been initiated in the Ross Sea through the concentration of a number of programs in the past ten years. It also is well known that the species diversity is reduced relative to other systems and its seasonal production is as great as anywhere in the Antarctic. Most importantly, seasonal production of both the total phytoplankton community (as well as its two functional groups) can be estimated from late summer nutrient profiles. The project will involve short cruises on the US Coast Guard ice breakers in the southern Ross Sea that will allow the collection of water column nutrient and particulate after data at specific locations in the late summer of each of five years. Additionally, two moorings with in situ nitrate analyzers moored at fifteen will be deployed, thus collecting for the first time in the in the Antarctic a time-series of euphotic zone nutrient concentrations over the entire growing season. All nutrient data will be used to calculate seasonal production for each year in the southern Ross Sea and compared to previously collected information, thereby providing an assessment of interannual variations in net community production. Particulate matter data will allow us to estimate the amount of export from the surface layer by late summer, and therefore calculate the interannual variability of this ecosystem process. Interannual variations of seasonal production (and of the major taxa of producers) are a potentially significant feature in the growth and survival of higher trophic levels within the food web of the Ross Sea. They are also important in order to understand the natural variability in biogeochemical processes of the region. Because polar regions such as the Ross Sea are predicted to be impacted by future climate change, biological changes are also anticipated. Placing these changes in the context of natural variability is an essential element of understanding and predicting such alterations. This research thus seeks to quantify the natural variability of an Antarctic coastal system, and ultimately understand its causes and impacts on food webs and biogeochemical cycles of the Ross Sea.
Related publications:
Smith, W.O., Jr., M.S. Dinniman, J.M. Klinck, and E. Hofmann. 2003. Biogeochemical climatologies in the Ross Sea, Antarctica: seasonal patterns of nutrients and biomass. Deep-Sea Res. II 50: 3083-3101.
Smith, W.O., Jr., A.R. Shields, J.A. Peloquin, G. Catalano, S. Tozzi, M.S. Dinniman and V.A. Asper. 2006. Biogeochemical budgets in the Ross Sea: variations among years. Deep-Sea Res. II 53: 815-833.
Tremblay, J.-E. and W.O. Smith, Jr. 2007. Phytoplankton processes in polynyas. In: Polynyas: Windows to the World’s Oceans (W.O. Smith, Jr. and D.G. Barber, eds.), Elsevier, Amsterdam, Pp. 239-270.
Smith, W.O. Jr. and D.G. Barber (Eds.). 2007. Polynyas: Windows to the World’s Oceans. Elsevier, Amsterdam. 437 pp.
Smith, W.O. Jr. and D.G. Barber. 2007. Polynyas and climate change: a view to the future. In: Polynyas: Windows to the World’s Oceans (W.O. Smith, Jr. and D.G. Barber, eds.), Elsevier, Amsterdam, Pp. 409-417.
Smith, W.O. Jr., D.G. Ainley and R. Cattaneo-Vietti. 2007. Trophic interactions within the Ross Sea continental shelf ecosystem. Phil. Trans. Roy. Soc., ser. B 362: 95-111.
Peloquin, J. A., and W. O. Smith, Jr. 2007. Phytoplankton blooms in the Ross Sea, Antarctica: Interannual variability in magnitude, temporal patterns, and composition. J. Geophys. Res. 112: C08013, doi:10.1029/2006JC003816.
Smith, W.O. Jr. and J.C. Comiso. 2009. Southern Ocean primary productivity: variability and a view to the future. In Smithsonian at the Poles: Contributions to International Polar Year Science (I. Krupnik, M.A. Lang, and S.E. Miller, Eds.), Smithsonian Inst. Scholarly Press, Washington, D.C., pp. 309-318.
Smith, W.O. Jr., M. Dinniman, G.R. DiTullio, S. Tozzi, O. Mangoni, M. Modigh and V. Saggiomo. 2010. Phytoplankton photosynthetic pigments in the Ross Sea: Patterns and relationships among functional groups. J. Mar. Systems 82: 177-185.
Smith, W.O. Jr., V. Asper, S. Tozzi, X. Liu and S.E. Stammerjohn. 2011a. Surface layer variability in the Ross Sea, Antarctica as assessed by in situ fluorescence measurements. Prog. Oceanogr. 88: 28-45 (doi: 10.1016/j.pocean.2010.08.002).
Smith, W.O. Jr., A.R. Shields, J. Dreyer, J.A. Peloquin and V. Asper. 2011b. Interannual variability in vertical export in the Ross Sea: magnitude, composition, and environmental correlates. Deep-Sea Res. I 58: 147-159.
Liu, X. and W.O. Smith, Jr. 2012. A statistical analysis of the controls on phytoplankton distribution in the Ross Sea, Antarctica. J. Mar. Systems 94: 135-144.
Smith, W.O. Jr., P.N. Sedwick, K.R. Arrigo, D.G. Ainley, and A.H. Orsi. 2012. The Ross Sea in a sea of change. Oceanography 25: 44-57.
Peloquin, J., C. Swan, N. Gruber, M. Vogt, H. Claustre, J. Ras, J. Uitz, J-C. Marty, R. Barlow, M. Behrenfeld, R. Bidigare, H. Dierssen, G. DiTullio, E. Fernandez, C. Gallienne, S. Gibb, R. Goericke, L. Harding, E. Head, P. Holligan, S. Hooker, D. Karl, T. Knap, M. Landry, R. Letelier, C.A. Llewellyn, M. Lomas, M. Lucas, A. Mannino, J.-C. Marty, B. G. Mitchell, F. Müller-Karger, N. Nelson, C. O'Brien, B. Prezelin, D. Repeta, W. O. Smith, Jr., D. Smythe-Wright, R. Stumpf, A. Subramaniam, K. Suzuki, C. Trees, M. Vernet, K. Wasmund, and S. Wright. 2014. The MAREDAT global database of high performance liquid chromatography marine pigment measurements. Earth System Science Data 5: 109-123.
Smith, W.O. Jr., D.G. Ainley, K.R. Arrigo, and M.S. Dinniman. 2014. The oceanography and ecology of the Ross Sea. Annu. Rev. Mar. Sci. 6: 469-487.
Smith, W.O., Jr. and K. Donaldson. 2015. Photosynthesis-irradiance responses in the Ross Sea, Antarctica: a meta-analysis. Biogeosciences 12: 1-11.
Asper, V.L. and W.O. Smith, Jr. Variations in the abundance and distribution of aggregates in the Ross Sea, Antarctica. Deep-Sea Res. I (submitted).
Smith, W.O., Jr. and D.E. Kaufman. Particulate organic carbon climatologies in the Ross Sea: evidence for seasonal acclimations within phytoplankton. Prog. Oceanogr. (submitted).
| Funding Source | Award |
|---|---|
| NSF Division of Polar Programs (NSF PLR) |
[ table of contents | back to top ]