Dissolved neodymium (Nd) isotopes and concentrations of rare-earth elements (REEs) reported by LDEO in seawater samples collected during the GEOTRACES GP16 East Pacific Zonal Transect cruise (TN303) on R/V Thomas G. Thompson from October to December 2013
Project
Program
| Contributors | Affiliation | Role |
|---|---|---|
| Goldstein, Steven L. | Lamont-Doherty Earth Observatory (LDEO) | Principal Investigator |
| Pena, Leopoldo D. | University of Barcelona (U Barcelona) | Co-Principal Investigator |
| Wu, Yingzhe | Lamont-Doherty Earth Observatory (LDEO) | Contact, Analyst |
| Basak, Chandranath | Lamont-Doherty Earth Observatory (LDEO) | Analyst |
| Bolge, Louise L. | Lamont-Doherty Earth Observatory (LDEO) | Technician |
| Rauch, Shannon | Woods Hole Oceanographic Institution (WHOI BCO-DMO) | BCO-DMO Data Manager |
Abstract
Seawater samples were collected during the GEOTRACES GP16 cruise on R/V Thomas G. Thompson (TN303) along the East Pacific Zonal Transect in 2013. Five liters (L) of seawater were collected and stored in a cubitainer for each sample. The samples were filtered using 0.2-micrometer (μm) Sartobran cartridges and acidified using ultrapure Seastar hydrochloric acid (HCl) to pH ~ 2 shortly after sampling.
For neodymium (Nd) isotope analysis, rare-earth elements (REEs) were preconcentrated from seawater using C18 cartridges (Waters Corp., Sep-Pak classic, 360-milligrams (mg), 55-105 μm) loaded with complexing agent composed of a mixture of 2-ethylhexyl hydrogen phosphate (HDEHP) and 2-ethylhexyl dihydrogen phosphate (H2MEHP), which was first proposed by Shabani et al. (1992). In this study, we followed the methods by Jeandel et al. (1998), Lacan and Jeandel (2001), and Pahnke et al. (2012). Specifically, C18 cartridges were first cleaned in a 0.5 N HCl bath overnight, passed through 10 milliliters (mL) of 6 N HCl and then flushed with >500 mL of Milli-Q water. Cartridges were stored in Milli-Q water after cleaning. 300 μL of complexing agent HDEHP/H2MEHP was loaded on a clean cartridge for a 5 L sample. Seawater samples were adjusted to pH ≈ 3.5 by adding Optima® ammonium hydroxide before being pumped through the cartridges at 20 mL/minute by a peristaltic pump in the ultra-clean chemistry laboratory at LDEO. Cartridges were then eluted with 10 mL of 0.01 N HCl to remove barium. After barium elution, cartridges were eluted with 35 mL of 6 N HCl at 10 mL/minute by a peristaltic pump to collect REEs. REEs were dried and further purified by TRU-spec column chemistry. Nd fractions were extracted from REEs by LN-spec column chemistry and dried. They were redissolved in 0.3 mL of 3% HNO3 for the Nd isotope analysis.
For REE concentration analysis, a multi-element REE spike enriched in 138La, 142Ce, 145Nd, 149Sm, 153Eu, 155Gd, 161Dy, 167Er, 171Yb, and 176Lu (Wu et al., 2020) was added to each sample (~10 mL). The sample-spike mixture was allowed to equilibrate for at least 24 hours and then was purified and pre-concentrated through the seaFast Automated Preconcentration System for Undiluted Seawater (Elemental Scientific Inc. or ESI, Omaha, Nebraska, USA).
The Nd isotopic composition is expressed as:
εNd = [(¹⁴³Nd/¹⁴⁴Ndsample/¹⁴³Nd/¹⁴⁴NdCHUR) - 1] × 10⁴
This study uses ¹⁴³Nd/¹⁴⁴NdCHUR = 0.512638 (Jacobsen and Wasserburg, 1980).
- Imported original file "DOoR_GEOTRACES GP16_eNd&REEs_LDEO.xlsx" into the BCO-DMO system.
- Flagged '-999' values as missing data values (missing data are blank/empty in the final CSV file).
- Renamed fields to comply with BCO-DMO naming conventions.
- Created the date/time field in ISO 8601 format.
- Removed the end lat/lon and end date/time columns (all empty).
- Saved the final file as "915447_v1_gp16_diss_nd_and_rees_ldeo.csv".
| File |
|---|
915447_v1_gp16_diss_nd_and_rees_ldeo.csv (Comma Separated Values (.csv), 88.12 KB) MD5:6be91f8240988af0da9f1fb13b1ab0a0 Primary data file for dataset ID 915447, version 1 |
Relationship Description: This collaborative project was investigated by Nd isotope groups at LDEO and OSU. The two groups analyzed samples at alternate stations.
| Parameter | Description | Units |
| Station_ID | Station number | unitless |
| ISO_DateTime_UTC_Start | Date and time (UTC) at start of sampling event in ISO 8601 format | unitless |
| Start_Date_UTC | Date at start of sampling event | unitless |
| Start_Time_UTC | Time (UTC) at start of sampling event | unitless |
| Start_Latitude | Latitude; North is positive. | decimal degrees |
| Start_Longitude | Longitude; East is positive. | decimal degrees |
| Event_ID | GEOTRACES event number | unitless |
| Sample_ID | GEOTRACES sample number | unitless |
| Sample_Depth | Sampling depth | meters (m) |
| CTDPRS_T_VALUE_SENSOR_vvdwtp | Sampling pressure of CTD | decibars (dbar) |
| SD1_CTDPRS_T_VALUE_SENSOR_vvdwtp | Standard deviation of CTDPRS_T_VALUE_SENSOR_vvdwtp | decibars (dbar) |
| Flag_CTDPRS_T_VALUE_SENSOR_vvdwtp | Quality flag for CTDPRS_T_VALUE_SENSOR_vvdwtp | unitless |
| CTDTMP_T_VALUE_SENSOR_fp7gnu | Sampling temperature of CTD | degrees Celsius |
| SD1_CTDTMP_T_VALUE_SENSOR_fp7gnu | Standard deviation of CTDTMP_T_VALUE_SENSOR_fp7gnu | degrees Celsius |
| Flag_CTDTMP_T_VALUE_SENSOR_fp7gnu | Quality flag for CTDTMP_T_VALUE_SENSOR_fp7gnu | unitless |
| CTDSAL_D_CONC_SENSOR_dipxfj | Sampling salinity of CTD | PSU? |
| SD1_CTDSAL_D_CONC_SENSOR_dipxfj | Standard deviation of CTDSAL_D_CONC_SENSOR_dipxfj | PSU? |
| Flag_CTDSAL_D_CONC_SENSOR_dipxfj | Quality flag for CTDSAL_D_CONC_SENSOR_dipxfj | unitless |
| CTDOXY_D_CONC_SENSOR_wpflfa | Sampling oxygen concentration of CTD | micromoles per kilogram (umol/kg) |
| SD1_CTDOXY_D_CONC_SENSOR_wpflfa | Standard deviation of CTDOXY_D_CONC_SENSOR_wpflfa | micromoles per kilogram (umol/kg) |
| Flag_CTDOXY_D_CONC_SENSOR_wpflfa | Quality flag for CTDOXY_D_CONC_SENSOR_wpflfa | unitless |
| SILICATE_D_CONC_BOTTLE_7ccpa2 | Silicate concentration | micromoles per kilogram (umol/kg) |
| SD1_SILICATE_D_CONC_BOTTLE_7ccpa2 | Standard deviation of SILICATE_D_CONC_BOTTLE_7ccpa2 | micromoles per kilogram (umol/kg) |
| Flag_SILICATE_D_CONC_BOTTLE_7ccpa2 | Quality flag for SILICATE_D_CONC_BOTTLE_7ccpa2 | unitless |
| PHOSPHATE_D_CONC_BOTTLE_145nsm | Phosphate concentration | micromoles per kilogram (umol/kg) |
| SD1_PHOSPHATE_D_CONC_BOTTLE_145nsm | Standard deviation of PHOSPHATE_D_CONC_BOTTLE_145nsm | micromoles per kilogram (umol/kg) |
| Flag_PHOSPHATE_D_CONC_BOTTLE_145nsm | Quality flag for PHOSPHATE_D_CONC_BOTTLE_145nsm | unitless |
| NITRATE_D_CONC_BOTTLE_oxilrz | Nitrate concentration | micromoles per kilogram (umol/kg) |
| SD1_NITRATE_D_CONC_BOTTLE_oxilrz | Standard deviation of NITRATE_D_CONC_BOTTLE_oxilrz | micromoles per kilogram (umol/kg) |
| Flag_NITRATE_D_CONC_BOTTLE_oxilrz | Quality flag for NITRATE_D_CONC_BOTTLE_oxilrz | unitless |
| Nd_143_144_D_EPSILON_BOTTLE_6yxwln | Dissolved 143Nd/144Nd ratio normalized to 0.512638 in parts per 10000 | unitless |
| SD1_Nd_143_144_D_EPSILON_BOTTLE_6yxwln | Standard deviation of Nd_143_144_D_EPSILON_BOTTLE_6yxwln. External 1 standard deviation of repeatedly measured JNdi standards during the analysis normalized to 0.512638 in parts per 10000 | unitless |
| Flag_Nd_143_144_D_EPSILON_BOTTLE_6yxwln | Quality flag for Nd_143_144_D_EPSILON_BOTTLE_6yxwln. Flag 1: data evaluated as Good; Flag 2: data quality not evaluated or unknown; Flag 3: data quality assessed to be questionable; Flag 4: data quality assessed to be Bad; Flag 9: no data | unitless |
| La_D_CONC_BOTTLE_3i8t0o | Dissolved Lanthanum (La) concentration | picomoles per kilogram (pmol/kg) |
| SD1_La_D_CONC_BOTTLE_3i8t0o | External 1 standard deviation of La_D_CONC_BOTTLE_3i8t0o | picomoles per kilogram (pmol/kg) |
| Flag_La_D_CONC_BOTTLE_3i8t0o | Quality flag for La_D_CONC_BOTTLE_3i8t0o. Flag 1: data evaluated as Good; Flag 2: data quality not evaluated or unknown; Flag 3: data quality assessed to be questionable; Flag 4: data quality assessed to be Bad; Flag 9: no data | unitless |
| Ce_D_CONC_BOTTLE_khndur | Dissolved Cerium (Ce) concentration | picomoles per kilogram (pmol/kg) |
| SD1_Ce_D_CONC_BOTTLE_khndur | External 1 standard deviation of Ce_D_CONC_BOTTLE_khndur | picomoles per kilogram (pmol/kg) |
| Flag_Ce_D_CONC_BOTTLE_khndur | Quality flag for Ce_D_CONC_BOTTLE_khndur. Flag 1: data evaluated as Good; Flag 2: data quality not evaluated or unknown; Flag 3: data quality assessed to be questionable; Flag 4: data quality assessed to be Bad; Flag 9: no data | unitless |
| Pr_D_CONC_BOTTLE_oxu3mt | Dissolved Praseodymium (Pr) concentration | picomoles per kilogram (pmol/kg) |
| SD1_Pr_D_CONC_BOTTLE_oxu3mt | External 1 standard deviation of Pr_D_CONC_BOTTLE_oxu3mt | picomoles per kilogram (pmol/kg) |
| Flag_Pr_D_CONC_BOTTLE_oxu3mt | Quality flag for Pr_D_CONC_BOTTLE_oxu3mt. Flag 1: data evaluated as Good; Flag 2: data quality not evaluated or unknown; Flag 3: data quality assessed to be questionable; Flag 4: data quality assessed to be Bad; Flag 9: no data | unitless |
| Nd_D_CONC_BOTTLE_awd28c | Dissolved Neodymium (Nd) concentration | picomoles per kilogram (pmol/kg) |
| SD1_Nd_D_CONC_BOTTLE_awd28c | External 1 standard deviation of Nd_D_CONC_BOTTLE_awd28c | picomoles per kilogram (pmol/kg) |
| Flag_Nd_D_CONC_BOTTLE_awd28c | Quality flag for Nd_D_CONC_BOTTLE_awd28c. Flag 1: data evaluated as Good; Flag 2: data quality not evaluated or unknown; Flag 3: data quality assessed to be questionable; Flag 4: data quality assessed to be Bad; Flag 9: no data | unitless |
| Sm_D_CONC_BOTTLE_iumac7 | Dissolved Samarium (Sm) concentration | picomoles per kilogram (pmol/kg) |
| SD1_Sm_D_CONC_BOTTLE_iumac7 | External 1 standard deviation of Sm_D_CONC_BOTTLE_iumac7 | picomoles per kilogram (pmol/kg) |
| Flag_Sm_D_CONC_BOTTLE_iumac7 | Quality flag for Sm_D_CONC_BOTTLE_iumac7. Flag 1: data evaluated as Good; Flag 2: data quality not evaluated or unknown; Flag 3: data quality assessed to be questionable; Flag 4: data quality assessed to be Bad; Flag 9: no data | unitless |
| Eu_D_CONC_BOTTLE_phoc0h | Dissolved Europium (Eu) concentration | picomoles per kilogram (pmol/kg) |
| SD1_Eu_D_CONC_BOTTLE_phoc0h | External 1 standard deviation of Eu_D_CONC_BOTTLE_phoc0h | picomoles per kilogram (pmol/kg) |
| Flag_Eu_D_CONC_BOTTLE_phoc0h | Quality flag for Eu_D_CONC_BOTTLE_phoc0h. Flag 1: data evaluated as Good; Flag 2: data quality not evaluated or unknown; Flag 3: data quality assessed to be questionable; Flag 4: data quality assessed to be Bad; Flag 9: no data | unitless |
| Gd_D_CONC_BOTTLE_mqpxwv | Dissolved Gadolinium (Gd) concentration | picomoles per kilogram (pmol/kg) |
| SD1_Gd_D_CONC_BOTTLE_mqpxwv | External 1 standard deviation of Gd_D_CONC_BOTTLE_mqpxwv | picomoles per kilogram (pmol/kg) |
| Flag_Gd_D_CONC_BOTTLE_mqpxwv | Quality flag for Gd_D_CONC_BOTTLE_mqpxwv. Flag 1: data evaluated as Good; Flag 2: data quality not evaluated or unknown; Flag 3: data quality assessed to be questionable; Flag 4: data quality assessed to be Bad; Flag 9: no data | unitless |
| Tb_D_CONC_BOTTLE_qn56fc | Dissolved Terbium (Tb) concentration | picomoles per kilogram (pmol/kg) |
| SD1_Tb_D_CONC_BOTTLE_qn56fc | External 1 standard deviation of Tb_D_CONC_BOTTLE_qn56fc | picomoles per kilogram (pmol/kg) |
| Flag_Tb_D_CONC_BOTTLE_qn56fc | Quality flag for Tb_D_CONC_BOTTLE_qn56fc. Flag 1: data evaluated as Good; Flag 2: data quality not evaluated or unknown; Flag 3: data quality assessed to be questionable; Flag 4: data quality assessed to be Bad; Flag 9: no data | unitless |
| Dy_D_CONC_BOTTLE_ryfy4p | Dissolved Dysprosium (Dy) concentration | picomoles per kilogram (pmol/kg) |
| SD1_Dy_D_CONC_BOTTLE_ryfy4p | External 1 standard deviation of Dy_D_CONC_BOTTLE_ryfy4p | picomoles per kilogram (pmol/kg) |
| Flag_Dy_D_CONC_BOTTLE_ryfy4p | Quality flag for Dy_D_CONC_BOTTLE_ryfy4p. Flag 1: data evaluated as Good; Flag 2: data quality not evaluated or unknown; Flag 3: data quality assessed to be questionable; Flag 4: data quality assessed to be Bad; Flag 9: no data | unitless |
| Ho_D_CONC_BOTTLE_viczuk | Dissolved Holmium (Ho) concentration | picomoles per kilogram (pmol/kg) |
| SD1_Ho_D_CONC_BOTTLE_viczuk | External 1 standard deviation of Ho_D_CONC_BOTTLE_viczuk | picomoles per kilogram (pmol/kg) |
| Flag_Ho_D_CONC_BOTTLE_viczuk | Quality flag for Ho_D_CONC_BOTTLE_viczuk. Flag 1: data evaluated as Good; Flag 2: data quality not evaluated or unknown; Flag 3: data quality assessed to be questionable; Flag 4: data quality assessed to be Bad; Flag 9: no data | unitless |
| Er_D_CONC_BOTTLE_toj6xw | Dissolved Erbium (Er) concentration | picomoles per kilogram (pmol/kg) |
| SD1_Er_D_CONC_BOTTLE_toj6xw | External 1 standard deviation of Er_D_CONC_BOTTLE_toj6xw | picomoles per kilogram (pmol/kg) |
| Flag_Er_D_CONC_BOTTLE_toj6xw | Quality flag for Er_D_CONC_BOTTLE_toj6xw. Flag 1: data evaluated as Good; Flag 2: data quality not evaluated or unknown; Flag 3: data quality assessed to be questionable; Flag 4: data quality assessed to be Bad; Flag 9: no data | unitless |
| Tm_D_CONC_BOTTLE_zv4lag | Dissolved Thulium (Tm) concentration | picomoles per kilogram (pmol/kg) |
| SD1_Tm_D_CONC_BOTTLE_zv4lag | External 1 standard deviation of Tm_D_CONC_BOTTLE_zv4lag | picomoles per kilogram (pmol/kg) |
| Flag_Tm_D_CONC_BOTTLE_zv4lag | Quality flag for Tm_D_CONC_BOTTLE_zv4lag. Flag 1: data evaluated as Good; Flag 2: data quality not evaluated or unknown; Flag 3: data quality assessed to be questionable; Flag 4: data quality assessed to be Bad; Flag 9: no data | unitless |
| Yb_D_CONC_BOTTLE_pdkue2 | Dissolved Ytterbium (Yb) concentration | picomoles per kilogram (pmol/kg) |
| SD1_Yb_D_CONC_BOTTLE_pdkue2 | External 1 standard deviation of Yb_D_CONC_BOTTLE_pdkue2 | picomoles per kilogram (pmol/kg) |
| Flag_Yb_D_CONC_BOTTLE_pdkue2 | Quality flag for Yb_D_CONC_BOTTLE_pdkue2. Flag 1: data evaluated as Good; Flag 2: data quality not evaluated or unknown; Flag 3: data quality assessed to be questionable; Flag 4: data quality assessed to be Bad; Flag 9: no data | unitless |
| Lu_D_CONC_BOTTLE_akkbyc | Dissolved Lutetium (Lu) concentration | picomoles per kilogram (pmol/kg) |
| SD1_Lu_D_CONC_BOTTLE_akkbyc | External 1 standard deviation of Lu_D_CONC_BOTTLE_akkbyc | picomoles per kilogram (pmol/kg) |
| Flag_Lu_D_CONC_BOTTLE_akkbyc | Quality flag for Lu_D_CONC_BOTTLE_akkbyc. Flag 1: data evaluated as Good; Flag 2: data quality not evaluated or unknown; Flag 3: data quality assessed to be questionable; Flag 4: data quality assessed to be Bad; Flag 9: no data | unitless |
| Nd_143_144_D_EPSILON_FISH_otveuu | Dissolved 143Nd/144Nd ratio normalized to 0.512638 in parts per 10000 | unitless |
| SD1_Nd_143_144_D_EPSILON_FISH_otveuu | Standard deviation of Nd_143_144_D_EPSILON_FISH_otveuu. External 1 standard deviation of repeatedly measured JNdi standards during the analysis normalized to 0.512638 in parts per 10000 | unitless |
| Flag_Nd_143_144_D_EPSILON_FISH_otveuu | Quality flag for Nd_143_144_D_EPSILON_FISH_otveuu. Flag 1: data evaluated as Good; Flag 2: data quality not evaluated or unknown; Flag 3: data quality assessed to be questionable; Flag 4: data quality assessed to be Bad; Flag 9: no data | unitless |
| La_D_CONC_FISH_h0emhv | Dissolved Lanthanum (La) concentration | picomoles per kilogram (pmol/kg) |
| SD1_La_D_CONC_FISH_h0emhv | External 1 standard deviation of La_D_CONC_FISH_h0emhv | picomoles per kilogram (pmol/kg) |
| Flag_La_D_CONC_FISH_h0emhv | Quality flag for La_D_CONC_FISH_h0emhv. Flag 1: data evaluated as Good; Flag 2: data quality not evaluated or unknown; Flag 3: data quality assessed to be questionable; Flag 4: data quality assessed to be Bad; Flag 9: no data | unitless |
| Ce_D_CONC_FISH_pfwxb4 | Dissolved Cerium (Ce) concentration | picomoles per kilogram (pmol/kg) |
| SD1_Ce_D_CONC_FISH_pfwxb4 | External 1 standard deviation of Ce_D_CONC_FISH_pfwxb4 | picomoles per kilogram (pmol/kg) |
| Flag_Ce_D_CONC_FISH_pfwxb4 | Quality flag for Ce_D_CONC_FISH_pfwxb4. Flag 1: data evaluated as Good; Flag 2: data quality not evaluated or unknown; Flag 3: data quality assessed to be questionable; Flag 4: data quality assessed to be Bad; Flag 9: no data | unitless |
| Pr_D_CONC_FISH_j8n3si | Dissolved Praseodymium (Pr) concentration | picomoles per kilogram (pmol/kg) |
| SD1_Pr_D_CONC_FISH_j8n3si | External 1 standard deviation of Pr_D_CONC_FISH_j8n3si | picomoles per kilogram (pmol/kg) |
| Flag_Pr_D_CONC_FISH_j8n3si | Quality flag for Pr_D_CONC_FISH_j8n3si. Flag 1: data evaluated as Good; Flag 2: data quality not evaluated or unknown; Flag 3: data quality assessed to be questionable; Flag 4: data quality assessed to be Bad; Flag 9: no data | unitless |
| Nd_D_CONC_FISH_ggfcf6 | Dissolved Neodymium (Nd) concentration | picomoles per kilogram (pmol/kg) |
| SD1_Nd_D_CONC_FISH_ggfcf6 | External 1 standard deviation of Nd_D_CONC_FISH_ggfcf6 | picomoles per kilogram (pmol/kg) |
| Flag_Nd_D_CONC_FISH_ggfcf6 | Quality flag for Nd_D_CONC_FISH_ggfcf6. Flag 1: data evaluated as Good; Flag 2: data quality not evaluated or unknown; Flag 3: data quality assessed to be questionable; Flag 4: data quality assessed to be Bad; Flag 9: no data | unitless |
| Sm_D_CONC_FISH_qjgqsy | Dissolved Samarium (Sm) concentration | picomoles per kilogram (pmol/kg) |
| SD1_Sm_D_CONC_FISH_qjgqsy | External 1 standard deviation of Sm_D_CONC_FISH_qjgqsy | picomoles per kilogram (pmol/kg) |
| Flag_Sm_D_CONC_FISH_qjgqsy | Quality flag for Sm_D_CONC_FISH_qjgqsy. Flag 1: data evaluated as Good; Flag 2: data quality not evaluated or unknown; Flag 3: data quality assessed to be questionable; Flag 4: data quality assessed to be Bad; Flag 9: no data | unitless |
| Eu_D_CONC_FISH_vyaby1 | Dissolved Europium (Eu) concentration | picomoles per kilogram (pmol/kg) |
| SD1_Eu_D_CONC_FISH_vyaby1 | External 1 standard deviation of Eu_D_CONC_FISH_vyaby1 | picomoles per kilogram (pmol/kg) |
| Flag_Eu_D_CONC_FISH_vyaby1 | Quality flag for Eu_D_CONC_FISH_vyaby1. Flag 1: data evaluated as Good; Flag 2: data quality not evaluated or unknown; Flag 3: data quality assessed to be questionable; Flag 4: data quality assessed to be Bad; Flag 9: no data | unitless |
| Gd_D_CONC_FISH_eud8ti | Dissolved Gadolinium (Gd) concentration | picomoles per kilogram (pmol/kg) |
| SD1_Gd_D_CONC_FISH_eud8ti | External 1 standard deviation of Gd_D_CONC_FISH_eud8ti | picomoles per kilogram (pmol/kg) |
| Flag_Gd_D_CONC_FISH_eud8ti | Quality flag for Gd_D_CONC_FISH_eud8ti. Flag 1: data evaluated as Good; Flag 2: data quality not evaluated or unknown; Flag 3: data quality assessed to be questionable; Flag 4: data quality assessed to be Bad; Flag 9: no data | unitless |
| Tb_D_CONC_FISH_3667kp | Dissolved Terbium (Tb) concentration | picomoles per kilogram (pmol/kg) |
| SD1_Tb_D_CONC_FISH_3667kp | External 1 standard deviation of Tb_D_CONC_FISH_3667kp | picomoles per kilogram (pmol/kg) |
| Flag_Tb_D_CONC_FISH_3667kp | Quality flag for Tb_D_CONC_FISH_3667kp. Flag 1: data evaluated as Good; Flag 2: data quality not evaluated or unknown; Flag 3: data quality assessed to be questionable; Flag 4: data quality assessed to be Bad; Flag 9: no data | unitless |
| Dy_D_CONC_FISH_wim6wr | Dissolved Dysprosium (Dy) concentration | picomoles per kilogram (pmol/kg) |
| SD1_Dy_D_CONC_FISH_wim6wr | External 1 standard deviation of Dy_D_CONC_FISH_wim6wr | picomoles per kilogram (pmol/kg) |
| Flag_Dy_D_CONC_FISH_wim6wr | Quality flag for Dy_D_CONC_FISH_wim6wr. Flag 1: data evaluated as Good; Flag 2: data quality not evaluated or unknown; Flag 3: data quality assessed to be questionable; Flag 4: data quality assessed to be Bad; Flag 9: no data | unitless |
| Ho_D_CONC_FISH_jz4sed | Dissolved Holmium (Ho) concentration | picomoles per kilogram (pmol/kg) |
| SD1_Ho_D_CONC_FISH_jz4sed | External 1 standard deviation of Ho_D_CONC_FISH_jz4sed | picomoles per kilogram (pmol/kg) |
| Flag_Ho_D_CONC_FISH_jz4sed | Quality flag for Ho_D_CONC_FISH_jz4sed. Flag 1: data evaluated as Good; Flag 2: data quality not evaluated or unknown; Flag 3: data quality assessed to be questionable; Flag 4: data quality assessed to be Bad; Flag 9: no data | unitless |
| Er_D_CONC_FISH_yj558b | Dissolved Erbium (Er) concentration | picomoles per kilogram (pmol/kg) |
| SD1_Er_D_CONC_FISH_yj558b | External 1 standard deviation of Er_D_CONC_FISH_yj558b | picomoles per kilogram (pmol/kg) |
| Flag_Er_D_CONC_FISH_yj558b | Quality flag for Er_D_CONC_FISH_yj558b. Flag 1: data evaluated as Good; Flag 2: data quality not evaluated or unknown; Flag 3: data quality assessed to be questionable; Flag 4: data quality assessed to be Bad; Flag 9: no data | unitless |
| Tm_D_CONC_FISH_69svdh | Dissolved Thulium (Tm) concentration | picomoles per kilogram (pmol/kg) |
| SD1_Tm_D_CONC_FISH_69svdh | External 1 standard deviation of Tm_D_CONC_FISH_69svdh | picomoles per kilogram (pmol/kg) |
| Flag_Tm_D_CONC_FISH_69svdh | Quality flag for Tm_D_CONC_FISH_69svdh. Flag 1: data evaluated as Good; Flag 2: data quality not evaluated or unknown; Flag 3: data quality assessed to be questionable; Flag 4: data quality assessed to be Bad; Flag 9: no data | unitless |
| Yb_D_CONC_FISH_wvyajs | Dissolved Ytterbium (Yb) concentration | picomoles per kilogram (pmol/kg) |
| SD1_Yb_D_CONC_FISH_wvyajs | External 1 standard deviation of Yb_D_CONC_FISH_wvyajs | picomoles per kilogram (pmol/kg) |
| Flag_Yb_D_CONC_FISH_wvyajs | Quality flag for Yb_D_CONC_FISH_wvyajs. Flag 1: data evaluated as Good; Flag 2: data quality not evaluated or unknown; Flag 3: data quality assessed to be questionable; Flag 4: data quality assessed to be Bad; Flag 9: no data | unitless |
| Lu_D_CONC_FISH_ajuhyg | Dissolved Lutetium (Lu) concentration | picomoles per kilogram (pmol/kg) |
| SD1_Lu_D_CONC_FISH_ajuhyg | External 1 standard deviation of Lu_D_CONC_FISH_ajuhyg | picomoles per kilogram (pmol/kg) |
| Flag_Lu_D_CONC_FISH_ajuhyg | Quality flag for Lu_D_CONC_FISH_ajuhyg. Flag 1: data evaluated as Good; Flag 2: data quality not evaluated or unknown; Flag 3: data quality assessed to be questionable; Flag 4: data quality assessed to be Bad; Flag 9: no data | unitless |
| Dataset-specific Instrument Name | GeoFish |
| Generic Instrument Name | GeoFish Towed near-Surface Sampler |
| Generic Instrument Description | The GeoFish towed sampler is a custom designed near surface (2 meters or less) sampling system for the collection of trace metal clean seawater. It consists of a PVC encapsulated lead weighted torpedo and separate PVC depressor vane supporting the intake utilizing all PFA Teflon tubing connected to a deck mounted, air-driven, PFA Teflon dual-diaphragm pump which provides trace-metal clean seawater at up to 3.7L/min. The GeoFish is towed at up to 13kts off to the side of the vessel outside of the ship's wake to avoid possible contamination from the ship's hull. It was developed by Geoffrey Smith and Ken Bruland (University of California, Santa Cruz). |
| Dataset-specific Instrument Name | Thermo Scientific Neptune-Plus® multicollector-inductively coupled plasma-mass spectrometer (MC-ICP-MS) |
| Generic Instrument Name | Multi Collector Inductively Coupled Plasma Mass Spectrometer |
| Dataset-specific Description | The Nd isotopic compositions were measured by a Thermo Scientific Neptune-Plus® multicollector-inductively coupled plasma-mass spectrometer (MC-ICP-MS) at LDEO. The instrument was coupled with a desolvation introduction system (an Apex nebulizer). All measured Nd isotopic compositions were corrected for mass fractionation using an exponential law with ¹⁴⁶Nd/¹⁴⁴Nd = 0.7219. For each analytical session, standard JNdi-1 was measured between every sample. For each sample, the measured Nd isotopic composition is normalized to ¹⁴³Nd/¹⁴⁴NdJNdi = 0.512115 (Tanaka et al., 2000), using the average measured JNd sample of a measuring session. JNdi-1 standards yielded external reproducibilities (2σ) as follows: ± 0.30 εNd units for 50 ppb solutions, ± 0.32 for 40 ppb, ± 0.36 for 30 ppb, ± 0.33 for 20 ppb, and ± 0.42 for 10 ppb. |
| Generic Instrument Description | A Multi Collector Inductively Coupled Plasma Mass Spectrometry (MC-ICPMS) is a type of mass spectrometry where the sample is ionized in a plasma (a partially ionized gas, such as Argon, containing free electrons) that has been generated by electromagnetic induction. A series of collectors is used to detect several ion beams simultaneously.
A MC-ICPMS is a hybrid mass spectrometer that combines the advantages of an inductively coupled plasma source and the precise measurements of a magnetic sector multicollector mass spectrometer. The primary advantage of the MC-ICPMS is its ability to analyze a broader range of elements, including those with high ionization potential that are difficult to analyze by Thermal Ionization Mass Spectrometry (TIMS). The ICP source also allows flexibility in how samples are introduced to the mass spectrometer and allows the analysis of samples introduced either as an aspirated solution or as an aerosol produced by laser ablation. |
| Dataset-specific Instrument Name | Niskin bottle |
| Generic Instrument Name | Niskin bottle |
| Generic Instrument Description | A Niskin bottle (a next generation water sampler based on the Nansen bottle) is a cylindrical, non-metallic water collection device with stoppers at both ends. The bottles can be attached individually on a hydrowire or deployed in 12, 24, or 36 bottle Rosette systems mounted on a frame and combined with a CTD. Niskin bottles are used to collect discrete water samples for a range of measurements including pigments, nutrients, plankton, etc. |
| Dataset-specific Instrument Name | VG PlasmaQuad ExCell® quadrupole ICP‐MS |
| Generic Instrument Name | Quadrupole Mass Spectrometer |
| Dataset-specific Description | The preconcentrated REEs were measured on a VG PlasmaQuad ExCell® quadrupole ICP‐MS, which was coupled to a desolvating introduction system (a CETAC Aridusᵀᴹ) that minimized molecular oxide ion formation with a self‐aspirated Apex ST PFA micro flow nebulizer (ESI). For quality control, the LDEO lab repeatedly analyzes seawater samples from a GEOTRACES intercalibration station Bermuda Atlantic Time Series (BATS; 31.7°N, 64.1°W) in the North Atlantic at 20 m (n = 18) and 2,000 m (n = 16) (Wu et al., 2020). For the BATS 20 and 2,000 m samples, long‐term external reproducibilities (2σ RSD%) range from 1.5% to 6.2%, depending on the element, using a two standard deviation filter on the data (Wu et al., 2020). Those elements showing small errors of |
| Generic Instrument Description | A piece of apparatus that consists of an ion source, a mass-to-charge analyser, a detector and a vacuum system and is used to measure mass spectra. The detector is a quadrupole mass-to-charge analyser, which holds the ions in a stable orbit by an electric field generated by four parallel electrodes.
|
TN303
| Website | |
| Platform | R/V Thomas G. Thompson |
| Report | |
| Start Date | 2013-10-25 |
| End Date | 2013-12-20 |
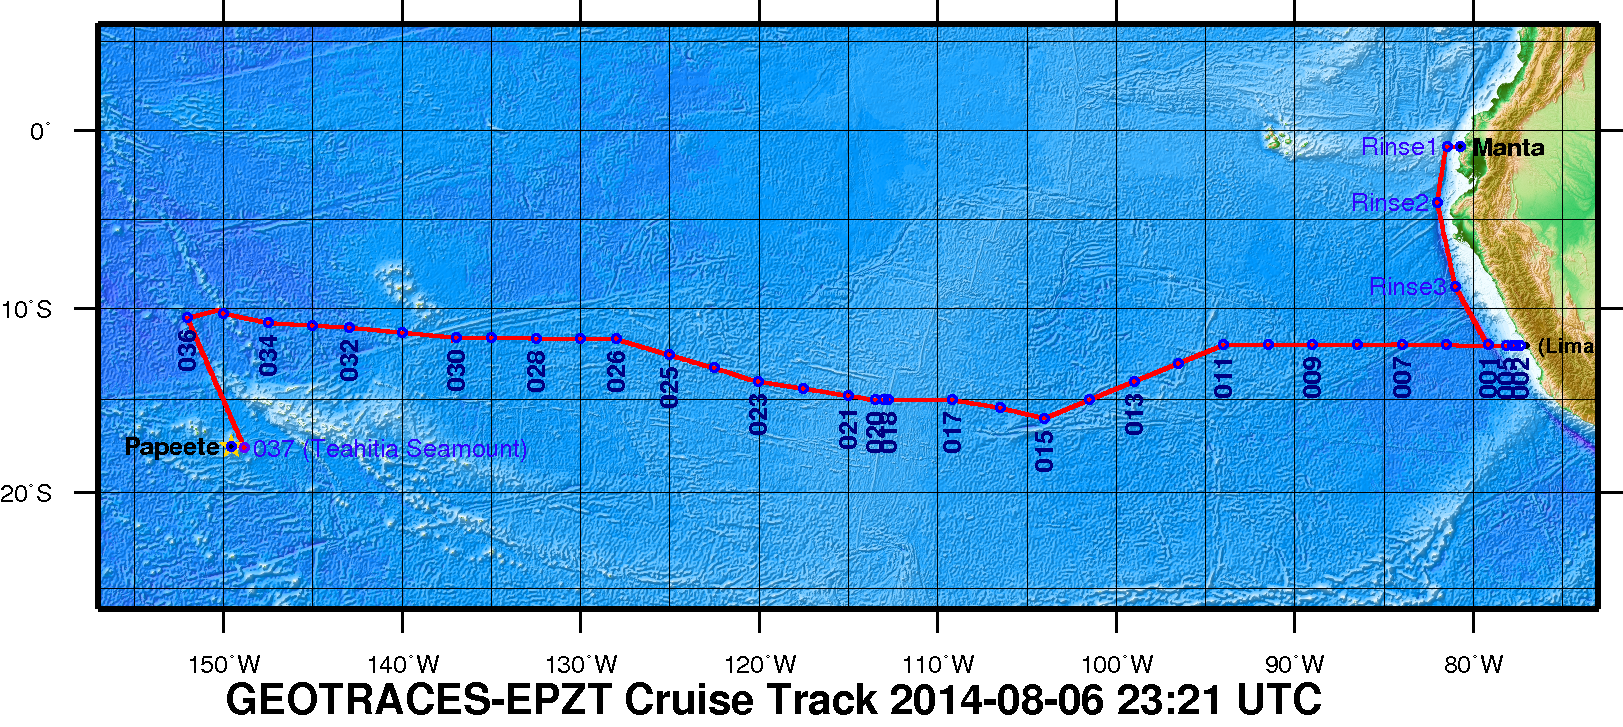
| Description | A zonal transect in the eastern tropical South Pacific (ETSP) from Peru to Tahiti as the second cruise of the U.S.GEOTRACES Program. This Pacific section includes a large area characterized by high rates of primary production and particle export in the eastern boundary associated with the Peru Upwelling, a large oxygen minimum zone that is a major global sink for fixed nitrogen, and a large hydrothermal plume arising from the East Pacific Rise. This particular section was selected as a result of open planning workshops in 2007 and 2008, with a final recommendation made by the U.S.GEOTRACES Steering Committee in 2009. It is the first part of a two-stage plan that will include a meridional section of the Pacific from Tahiti to Alaska as a subsequent expedition.
Figure 1. The 2013 GEOTRACES EPZT Cruise Track. [click on the image to view a larger version]
Additional cruise information is available from the Rolling Deck to Repository (R2R): http://www.rvdata.us/catalog/TN303 |
U.S. GEOTRACES East Pacific Zonal Transect (GP16) (U.S. GEOTRACES EPZT)
From the NSF Award Abstract
The mission of the International GEOTRACES Program (https://www.geotraces.org/), of which the U.S. chemical oceanography research community is a founding member, is "to identify processes and quantify fluxes that control the distributions of key trace elements and isotopes in the ocean, and to establish the sensitivity of these distributions to changing environmental conditions" (GEOTRACES Science Plan, 2006). In the United States, ocean chemists are currently in the process of organizing a zonal transect in the eastern tropical South Pacific (ETSP) from Peru to Tahiti as the second cruise of the U.S.GEOTRACES Program. This Pacific section includes a large area characterized by high rates of primary production and particle export in the eastern boundary associated with the Peru Upwelling, a large oxygen minimum zone that is a major global sink for fixed nitrogen, and a large hydrothermal plume arising from the East Pacific Rise. This particular section was selected as a result of open planning workshops in 2007 and 2008, with a final recommendation made by the U.S.GEOTRACES Steering Committee in 2009. It is the first part of a two-stage plan that will include a meridional section of the Pacific from Tahiti to Alaska as a subsequent expedition.
This award provides funding for management of the U.S.GEOTRACES Pacific campaign to a team of scientists from the University of Southern California, Old Dominion University, and the Woods Hole Oceanographic Institution. The three co-leaders will provide mission leadership, essential support services, and management structure for acquiring the trace elements and isotopes samples listed as core parameters in the International GEOTRACES Science Plan, plus hydrographic and nutrient data needed by participating investigators. With this support from NSF, the management team will (1) plan and coordinate the 52-day Pacific research cruise described above; (2) obtain representative samples for a wide variety of trace metals of interest using conventional CTD/rosette and GEOTRACES Sampling Systems; (3) acquire conventional JGOFS/WOCE-quality hydrographic data (CTD, transmissometer, fluorometer, oxygen sensor, etc) along with discrete samples for salinity, dissolved oxygen (to 1 uM detection limits), plant pigments, redox tracers such as ammonium and nitrite, and dissolved nutrients at micro- and nanomolar levels; (4) ensure that proper QA/QC protocols are followed and reported, as well as fulfilling all GEOTRACES Intercalibration protocols; (5) prepare and deliver all hydrographic-type data to the GEOTRACES Data Center (and US data centers); and (6) coordinate cruise communications between all participating investigators, including preparation of a hydrographic report/publication.
Broader Impacts: The project is part of an international collaborative program that has forged strong partnerships in the intercalibration and implementation phases that are unprecedented in chemical oceanography. The science product of these collective missions will enhance our ability to understand how to interpret the chemical composition of the ocean, and interpret how climate change will affect ocean chemistry. Partnerships include contributions to the infrastructure of developing nations with overlapping interests in the study area, in this case Peru. There is a strong educational component to the program, with many Ph.D. students carrying out thesis research within the program.
Figure 1. The 2013 GEOTRACES EPZT Cruise Track. [click on the image to view a larger version]
Collaborative Research: GEOTRACES Pacific Section - Nd isotopes and REEs in the South Pacific (EPZT Nd REEs)
NSF abstract:
Neodymium isotopes (Nd) and rare earth elements (REE) are recognized by the GEOTRACES program as key trace elements and isotopes (TEIs) because they trace the sources and mixing of water masses. Therefore, transport data generated by Nd measurements will potentially advance our understanding on the dominant processes that drive TEI distribution in the ocean. There is a particular need for Nd measurements in the South Pacific because current observations do not agree with GCM models. Researchers from Columbia University and Oregon State University will analyze seawater, aerosols, water column particulates, and sea-floor sediments for Nd, strontrium, and REE during the upcoming 2013 GEOTRACES cruise. Because of the geographical transect of the GEOTRACES Pacific section cruise, investigators will assess impacts made by a suite of biological, chemical, and physical processes including: boundary exchange, high productivity, surface addition from aerosols, addition to bottom waters from detached nephloid layers, particles from hydrothermal vents, reversible scavenging, and groundwater fluxes. Furthermore, within the Peru-Chili Oxygen Minimum Zone (OMZ), investigators will utilize the TEI cerium to better understand relative effects of lateral and vertical processes. By improving understanding of the distribution of TEIs, results will also enhance biogeochemical models and advance knowledge of climate systems.
Broader Impacts: Research will advance careers of two young scientists, support education and training of Ph.D. and undergraduate students, and provide materials for outreach activities. Additionally, results will be published in scientific journals and all data will be submitted to the Biological and Chemical Oceanography Data Management Office.
U.S. GEOTRACES (U.S. GEOTRACES)
GEOTRACES is a SCOR sponsored program; and funding for program infrastructure development is provided by the U.S. National Science Foundation.
GEOTRACES gained momentum following a special symposium, S02: Biogeochemical cycling of trace elements and isotopes in the ocean and applications to constrain contemporary marine processes (GEOSECS II), at a 2003 Goldschmidt meeting convened in Japan. The GEOSECS II acronym referred to the Geochemical Ocean Section Studies To determine full water column distributions of selected trace elements and isotopes, including their concentration, chemical speciation, and physical form, along a sufficient number of sections in each ocean basin to establish the principal relationships between these distributions and with more traditional hydrographic parameters;
* To evaluate the sources, sinks, and internal cycling of these species and thereby characterize more completely the physical, chemical and biological processes regulating their distributions, and the sensitivity of these processes to global change; and
* To understand the processes that control the concentrations of geochemical species used for proxies of the past environment, both in the water column and in the substrates that reflect the water column.
GEOTRACES will be global in scope, consisting of ocean sections complemented by regional process studies. Sections and process studies will combine fieldwork, laboratory experiments and modelling. Beyond realizing the scientific objectives identified above, a natural outcome of this work will be to build a community of marine scientists who understand the processes regulating trace element cycles sufficiently well to exploit this knowledge reliably in future interdisciplinary studies.
Expand "Projects" below for information about and data resulting from individual US GEOTRACES research projects.
| Funding Source | Award |
|---|---|
| NSF Division of Ocean Sciences (NSF OCE) |
[ table of contents | back to top ]