


Abstract
DNA sequencing continues to decrease in cost with the Illumina HiSeq2000 generating up to 600 Gb of paired-end 100 base reads in a ten-day run. Here we present a protocol for community amplicon sequencing on the HiSeq2000 and MiSeq Illumina platforms, and apply that protocol to sequence 24 microbial communities from host-associated and free-living environments. A critical question as more sequencing platforms become available is whether biological conclusions derived on one platform are consistent with what would be derived on a different platform. We show that the protocol developed for these instruments successfully recaptures known biological results, and additionally that biological conclusions are consistent across sequencing platforms (the HiSeq2000 versus the MiSeq) and across the sequenced regions of amplicons.
Main
DNA sequencing cost continues to decline: a vast price per sequence decrease on Illumina HiSeq2000 and MiSeq platforms further supports democratization of sequencing (Tringe and Hugenholtz, 2008). Interest in amplicon sequencing on Illumina is growing (Bartram et al., 2011; Caporaso et al., 2011; Zhou et al., 2011), largely due to lower cost per sequence than other platforms, enabling high-throughput microbial ecology at the greatest coverage yet possible. Although some technical issues exist with community sequencing, such as PCR primer biases and differential DNA extraction efficiency from different organisms in complex communities, these techniques continue to vastly expand our understanding of the microbial world.
Here we present an amplicon sequencing protocol for the HiSeq2000 and MiSeq platforms, and apply this protocol to sequence host-associated and free-living microbial communities to verify that biological conclusions drawn from the data are consistent across platforms and sequence reads. The HiSeq and MiSeq platforms differ markedly in scale. The HiSeq2000 produces >50 Gb per day, and in the course of a 10.8 day run produces 1.6 billion 100-base paired-end reads. By contrast, the MiSeq is for single-day experiments, and generates 1.5 Gb per day from 5 million 150-base paired-end reads. Our results capture known differences between microbial communities on each platform; biological conclusions drawn are consistent across platforms and sequence reads. This protocol is therefore ready for widespread use in microbial community analysis, such as by the Earth Microbiome Project (Gilbert et al., 2010), which has adopted it for amplicon sequencing. Details on the sequencing protocol are provided as Supplementary Methods.
Twenty-four samples were sequenced on three paired-end Illumina HiSeq2000 lanes, and in one paired-end MiSeq run. The samples represented soil (source: USA; n=8) and several host-associated environment types: human feces (source: USA; n=2), mouth (source: USA; n=2) and skin (source: USA; n=6); canine feces (source: USA; n=1) mouth (source: USA; n=1) and skin (source: USA; n=4). These four paired-end lanes (three on HiSeq and one on MiSeq) resulted in eight sets of reads, corresponding to 5′ and 3′ reads from each lane. These sets of reads were treated as independent replicates to assess the reproducibility of the results.
We were primarily interested in whether known differences between microbial communities could be recaptured on these Illumina platforms to determine their suitability for large-scale surveys of microbial communities. We observed several expected results in principal coordinates plots of weighted UniFrac distances (Figure 1). First, we observed primary separation of samples based on whether they were derived from a free-living environment (soil; cyan) or host-associated environment (all other colors) (Ley et al., 2008). Next we observed separation of fecal samples (yellow; red) from all other host-associated sample types (Costello et al., 2009).
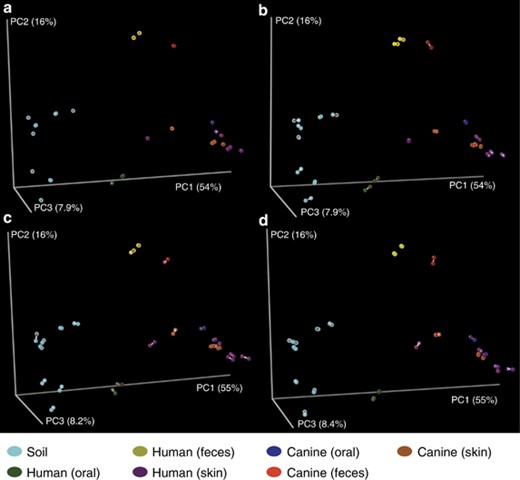
Procrustes plots comparing: (a) 5′ reads from HiSeq lane 6 to 5′ reads from HiSeq lane 8; (b) 5′ reads from HiSeq lane 6 to 3′ reads from HiSeq lane 8; (c) 5′ reads from HiSeq lane 6 to 5′ MiSeq reads; (d) 5′ MiSeq reads to 3′ MiSeq reads. Lines connect paired samples.
We were additionally interested in reproducibility across lanes and reads within and between each platform. To test this, we ran the 24 samples on three HiSeq paired-end lanes and 1 MiSeq paired-end lane, and analyzed each resulting set of reads independently. As our biological conclusions are frequently driven by the results of principal coordinates analyses based on weighted UniFrac distances, we compared these plots using Procrustes analysis (Gower, 1975; Figure 1; Table 1) as implemented in QIIME and found that the observations were highly reproducible across lanes, read directions and platforms. All 28 possible lane/read pair combinations produced highly significant P-values based on 10 000 Monte Carlo iterations (P<0.0001; Bonferroni-adjusted α0.01=0.0004).
M2 and Monte Carlo P-values for all Procrustes comparisons
| HiSeq lane 6, 5′ | HiSeq lane 6, 3′ | HiSeq lane 7, 5′ | HiSeq lane 7, 3′ | HiSeq lane 8, 5′ | HiSeq lane 8, 3′ | MiSeq, 5′ | MiSeq, 3′ | |
|---|---|---|---|---|---|---|---|---|
| Procrustes M2 | ||||||||
| HiSeq lane 6, 5′ | ||||||||
| HiSeq lane 6, 3′ | 0.006 | |||||||
| HiSeq lane 7, 5′ | 0.000 | 0.006 | ||||||
| HiSeq lane 7, 3′ | 0.005 | 0.000 | 0.006 | |||||
| HiSeq lane 8, 5′ | 0.000 | 0.006 | 0.000 | 0.005 | ||||
| HiSeq lane 8, 3′ | 0.005 | 0.000 | 0.006 | 0.006 | 0.006 | |||
| MiSeq, 5′ | 0.006 | 0.009 | 0.006 | 0.008 | 0.007 | 0.008 | ||
| MiSeq, 3′ | 0.007 | 0.007 | 0.007 | 0.007 | 0.007 | 0.008 | 0.002 | |
| P-value (based on 10 000 Monte Carlo iterations) | ||||||||
| HiSeq lane 6, 5′ | ||||||||
| HiSeq lane 6, 3′ | 0.0000 | |||||||
| HiSeq lane 7, 5′ | 0.0000 | 0.0000 | ||||||
| HiSeq lane 7, 3′ | 0.0000 | 0.0000 | 0.0000 | |||||
| HiSeq lane 8, 5′ | 0.0000 | 0.0000 | 0.0000 | 0.0000 | ||||
| HiSeq lane 8, 3′ | 0.0000 | 0.0000 | 0.0000 | 0.0000 | 0.0000 | |||
| MiSeq, 5′ | 0.0000 | 0.0000 | 0.0000 | 0.0000 | 0.0000 | 0.0000 | ||
| MiSeq, 3′ | 0.0000 | 0.0000 | 0.0000 | 0.0000 | 0.0000 | 0.0000 | 0.0000 | |
Taken together, these results suggest that the protocol previously developed for high-throughput community sequencing on the Illumina GAIIx has been successfully adapted for the HiSeq2000 and MiSeq platforms, again greatly decreasing the cost per sequence of amplicon sequencing to ∼15 000 single-end reads per USD$1 on the HiSeq2000. For example, based on our lowest high-quality sequence per lane count of 22 928 291 reads (Supplementary File 2, HiSeq 3′ lane 6), if using all 2167 barcodes in each of 15 lanes on the HiSeq2000, leaving one lane for a control, then it is possible to sequence 32 505 samples in a week at a depth of 10 580 sequences per sample for approximately $22 000 in sequencing costs. Longer barcodes could additionally be developed to facilitate more sequences per sample at a lower depth of sequencing. On the basis of the lowest high-quality sequence count on the MiSeq of 1 603 532 reads (Supplementary File 2, MiSeq 3′), if using all 2167 barcodes, it is possible to sequence 2167 samples in a 12 h run at a depth of 740 sequence per sample for approximately $800 in sequencing costs.
A relevant question is whether the decreased cost of sequencing should be applied to obtain deeper coverage of samples, or to increase the number of samples that are sequenced. Figure 1c compares the results of sequencing the same samples on the HiSeq 2000 at a median depth of 1207 709 sequences per sample and the MiSeq platform at a depth of 43 271 sequences per sample. The highly significant Procrustes result (P<0.0001) implies that we draw the same beta diversity conclusions from either sequencing run, despite a two order of magnitude increase in sequencing depth on the HiSeq2000. Similarly, when sampling to only 10 sequences per sample Procrustes results are still highly significant (P<0.0001; Supplementary Figure 1), although the higher M2 value indicates that the correlation is not as strong as when sampling to 100 sequences per sample. These observations, in agreement with studies that have addressed this question directly (Kuczynski et al., 2010), suggest that increasing the sequencing depth is not likely to provide additional insight into questions of beta diversity, and we therefore argue that (for questions of beta diversity in particular) the decreased cost of sequencing should be applied to study microbial systems using many more samples, for example, in dense temporal or spatial analyses, rather than with many more sequences per sample. Of course, if the objective is to identify taxa that are very rare in communities, deeper sequencing will be advantageous. Additionally we note that while as few as 10 sequences per sample may be useful for differentiating very different environment types (for example, soil and feces), as environments become more similar (for example, two soil samples of different pH) more sequences will be required to differentiate them.
As sequencing costs continue to decrease our studies of the microbial world can continue to increase in scope. The protocol presented here opens the HiSeq2000 and MiSeq Illumina platforms to community amplicon sequencing. The data generated by each is similar, but differs in scale and therefore support different applications. For large projects where time is less of an issue but cost per sequence is a major concern, the HiSeq platform allows massively parallel sequencing at the lowest cost. Here we show that comparable data can be generated on the MiSeq for smaller projects where it is important to process samples quickly, for example, in routine environmental or patient monitoring or in preliminary investigations for larger projects. We expect that this is another step toward the era of ubiquitous DNA sequencing, when sequencers become standard equipment in research and clinical laboratories. Finally, we show that technical replicates run on different sequencing platforms and from sequencing of different regions of amplicons should yield the same biological conclusions: critical information as more sequencing platforms become available.
Acknowledgements
We wish to thank the National Ecological Observatory Network (a project sponsored by the National Science Foundation and managed under cooperative agreement by NEON, Inc.) for donation of the soil samples; and Aurelie Breton and Joshua Quick for running the MiSeq instrument. This work was funded in part by Amazon Web Services, NIH, Crohn's and Colitis Foundation of America, The Bill and Melinda Gates Foundation, and the Howard Hughes Medical Institute.
Competing interests
Conflict of interest
Several authors on this manuscript are employees of Illumina, Inc., whose technology is tested in this study.
References
Supplementary Information accompanies the paper on The ISME Journal website
Supplementary information The online version of this article (doi:10.1038/ismej.2012.8) contains supplementary material, which is available to authorized users.
