Along-stream flux per unit width at station B located at an oyster reef in Wassaw Sound, Georgia in November of 2014 (SensoryNCE project)
Project
| Contributors | Affiliation | Role |
|---|---|---|
| Weissburg, Marc | Georgia Institute of Technology (GA Tech) | Principal Investigator |
| Kubanek, Julia | Georgia Institute of Technology (GA Tech) | Co-Principal Investigator |
| Webster, Donald | Georgia Institute of Technology (GA Tech) | Co-Principal Investigator, Contact |
| York, Amber D. | Woods Hole Oceanographic Institution (WHOI BCO-DMO) | BCO-DMO Data Manager |
This dataset contains data from an Aquadopp current profiler stationed station B, located at an oyster reef in Wassaw Sound, Georgia from November 3rd to 6th, 2014. The data include pressure, temperature, streamwise flux, cross-stream flux, and vertical flux.
These data were published in Young et al., 2016 (see Fig. 5) :
In addition to the "Get data" button above which provides various options to download the data in ASCII format, the originally submitted data in MATLAB .mat format (SensorAndRotatedQ_Filt123Q_30sec.mat, 199 KB)
The equipment used is a current profiler (Nortek Aquadopp HR-profiler). The Aquadopp measures the flow velocity in a series of evenly-spaced vertical bins. The Aquadopp measurements have a resolution of 3 mm/s and were collected continuously at 1 Hz. The Aquadopp returned the velocity within 10 cm vertical bins, equally spaced from 0.3 to 2.2 m above the instrument.
Sampling Location Map:
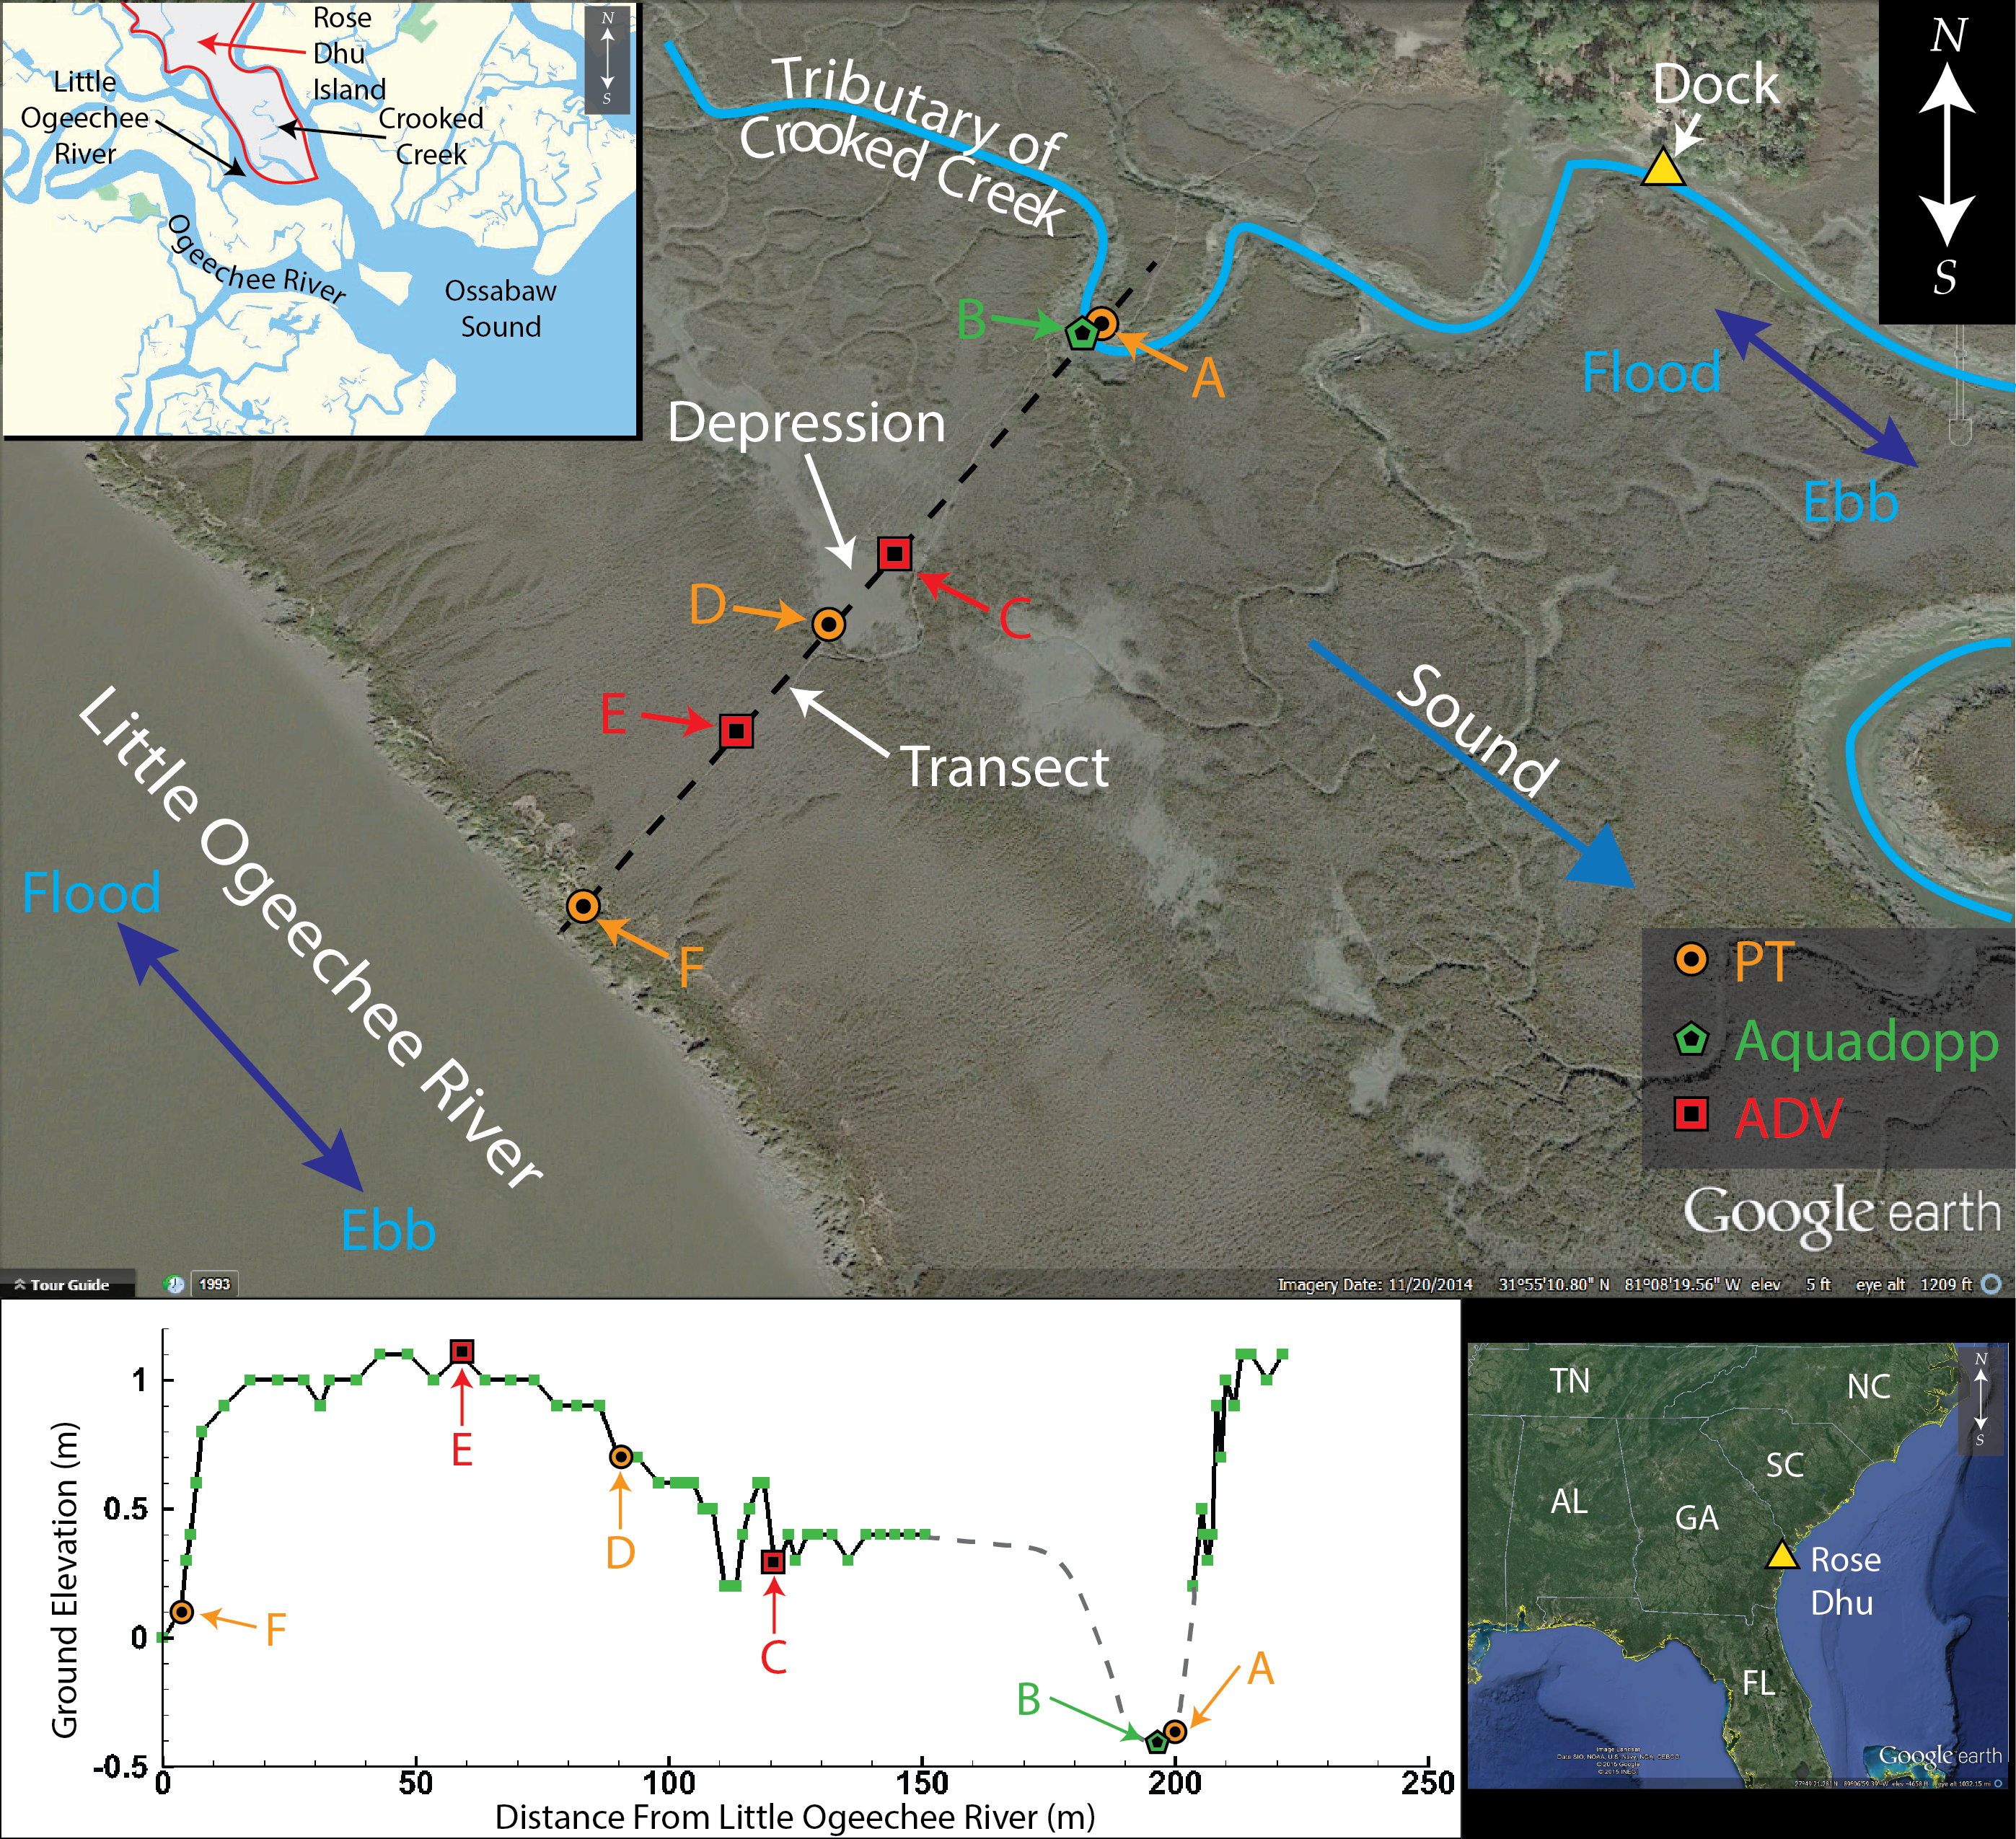
Image courtesy of David Young
Dry bins were identified using the built-in PT and temperature gauges to estimate the water depth above the instrument. All bins in which the water depth had not reached at least the midpoint of the next highest bin were discarded. The velocity measurements in each bin were averaged over 30 sec intervals to smooth out turbulent velocity fluctuations. The flux-per-unit-width (q) was estimated by summing the velocity in each bin multiplied by the bin height. Flux-per-unit-width therefore corresponded to the fluid flow through a vertical line extending from the Aquadopp to the surface. An ellipse was fit to a scatter plot of the measured east and north flux components for each Aquadopp, and the major axis of the resulting ellipse was defined as the “along-stream” flow direction. Correspondingly, the minor axis is defined as the “cross-stream” direction. The horizontal flux vector was rotated to correspond to the defined along-stream and cross-stream directions.
BCO-DMO Data Manager Processing Notes:
* added a conventional header with dataset name, PI name, version date
* data extracted from MATLAB .mat files to ASCII flat files to serve in the BCO-DMO system
* modified parameter names to conform with BCO-DMO naming conventions
* added approximate lat and lon of sampling location to data
* Time format changed from matlab datenum to Date and Time (yyyy-mm-dd,HH:MM:SS)
* Data version 2 (2018-07-12) replaces data version 1 (2017-07-20) - improved metadata, added timestamp in UTC in addition to local date/time
| File |
|---|
Flux_B.csv (Comma Separated Values (.csv), 578.03 KB) MD5:8abeadddb7b9f49ce2dea396a8e79001 Primary data file for dataset ID 709402 |
| Parameter | Description | Units |
| date | Date (local EST) in format yyyy-mm-dd | unitless |
| time | Time (local EST) in format HH:MM:SS | unitless |
| pressure | Aquadopp pressure | dBar |
| temperature | Aquadopp temperature | degrees C |
| streamwise_flux | Stream-wise flux | m3/s per m |
| cross_stream_flux | Cross-steram flux | m3/s per m |
| vertical_flux | Vertical flux | m3/s per m |
| lat_approx | Approximate latitude | decimal degrees |
| lon_approx | Approximate longitude | decimal degrees |
| ISO_DateTime_UTC | Timestamp (UTC) in standard ISO 8601:2004(E) format YYYY-mm-ddTHH:MM:SSZ | unitless |
| Dataset-specific Instrument Name | Nortek Aquadopp HR-profiler |
| Generic Instrument Name | Acoustic Doppler Current Profiler |
| Dataset-specific Description | current profiler (Nortek Aquadopp HR-profiler). |
| Generic Instrument Description | The ADCP measures water currents with sound, using a principle of sound waves called the Doppler effect. A sound wave has a higher frequency, or pitch, when it moves to you than when it moves away. You hear the Doppler effect in action when a car speeds past with a characteristic building of sound that fades when the car passes. The ADCP works by transmitting "pings" of sound at a constant frequency into the water. (The pings are so highly pitched that humans and even dolphins can't hear them.) As the sound waves travel, they ricochet off particles suspended in the moving water, and reflect back to the instrument. Due to the Doppler effect, sound waves bounced back from a particle moving away from the profiler have a slightly lowered frequency when they return. Particles moving toward the instrument send back higher frequency waves. The difference in frequency between the waves the profiler sends out and the waves it receives is called the Doppler shift. The instrument uses this shift to calculate how fast the particle and the water around it are moving. Sound waves that hit particles far from the profiler take longer to come back than waves that strike close by. By measuring the time it takes for the waves to bounce back and the Doppler shift, the profiler can measure current speed at many different depths with each series of pings. (More from WHOI instruments listing). |
SensoryNCE_2014
| Website | |
| Platform | Wassaw_Sound_GA |
| Start Date | 2014-11-03 |
| End Date | 2014-11-06 |
| Description | Wassaw Sound, Georgia |
The role of the sensory environment and predator chemical signal properties in determining NCE strength in cascading interactions on oyster reefs (SensoryNCE)
Extracted from the NSF award abstract:
In this project, the investigators will examine the ability of top blue crab predators to indirectly benefit the abundance of basal oyster prey by reducing the density (consumptive effects, CEs) and suppressing foraging (non-consumptive effects, NCEs) of intermediate mud crab predators. These NCEs are mediated by chemical perception of aversive cues in blue crab urine and produce a behaviorally mediated trophic cascade. Through a series of manipulative experiments, the investigators will examine how the strength of this behaviorally-mediated trophic cascade is modulated and factors that influence perceptive range such as predator diet and intake rate, and the flow environment. The investigators will also determine the chemical identity, concentration and release rate of chemical cues.
Identifying the quantitative and molecular aspects of aversive cues, and linking them to behavioral responses that produce trophic cascades establishes the chemical basis of risk perception by prey and how this translates into cascading ecological effects. The use of perceptive range as a framework for evaluating the effects of both chemistry and environment provides an integrated view of processes affecting chemically-mediated NCEs. The use of a water borne predator-prey signaling system to test ideas on the strength of NCEs should have broad applications.
| Funding Source | Award |
|---|---|
| NSF Division of Ocean Sciences (NSF OCE) |
[ table of contents | back to top ]