Georges Bank Northeast Peak ADCP data from GB NEP Mooring NEP_buoy_dep3.3, NEP_buoy_dep3.2 in the Georges Bank, Northeast Peak from 1997 (GB project)
Project
Program
| Contributors | Affiliation | Role |
|---|---|---|
| Beardsley, Robert C. | Woods Hole Oceanographic Institution (WHOI) | Principal Investigator |
| Irish, Jim | Woods Hole Oceanographic Institution (WHOI) | Principal Investigator |
| Copley, Nancy | Woods Hole Oceanographic Institution (WHOI BCO-DMO) | BCO-DMO Data Manager |
"As part of the U.S. GLOBEC Northwest Atlantic/Georges Bank program, moorings were deployed on Georges Bank as part of the broad-scale survey component to help measure the temporal variability of both physical and biological characteristics on the Bank. The array consisted of a primary mooring site on the Southern Flank which was maintained for the full 5-year duration of the field program, plus secondary moorings, with fewer sensors and of shorter duration, in the well-mixed water on the Crest and in the cod/haddock spawning region on the Northeast Peak. Temperature and conductivity (salinity) were measured at 5-m intervals, ADCP velocity profiles were obtained with 1-m vertical resolution, and bio-optical packages (measuring fluorescence, optical transmission and photosynthetically active radiation) were deployed at 10-m and 40-m depths. Bottom pressure was measured at the Southern Flank site. The buoy design, sensors and mooring configuration is presented and discussed below, and the data obtained is presented and discussed in an accompanying report "U.S. GLOBEC Georges Bank Long-Term Moored Program: Data Report." (December 2005 WHOI-2005-11; " U.S. GLOBEC Georges Bank Long-Term Moored Program: Part 1 - Mooring Configuration" by J.D. Irish, S. Kerry, P. Fucile, R.C. Beardsley, J. Lord, and Ken Brink.)
"Long-term moorings were deployed on Georges Bank from the fall of 1994 through the summer of 1999. The Southern Flank site was occupied all years, the Crest just the first and the Northeast Peak the second, fourth and fifth years. Not all depths were occupied by all sensors at all times." (DRAFT REPORT - 27 April 2005, WHOI-2005-XX, "U.S. GLOBEC Georges Bank Long-Term Moored Program: Part 2 - Yearly Data Summary and Report" J.D. Irish, R.C. Beardsley, M. Caruso, R. Limeburner, and Ken Brink)
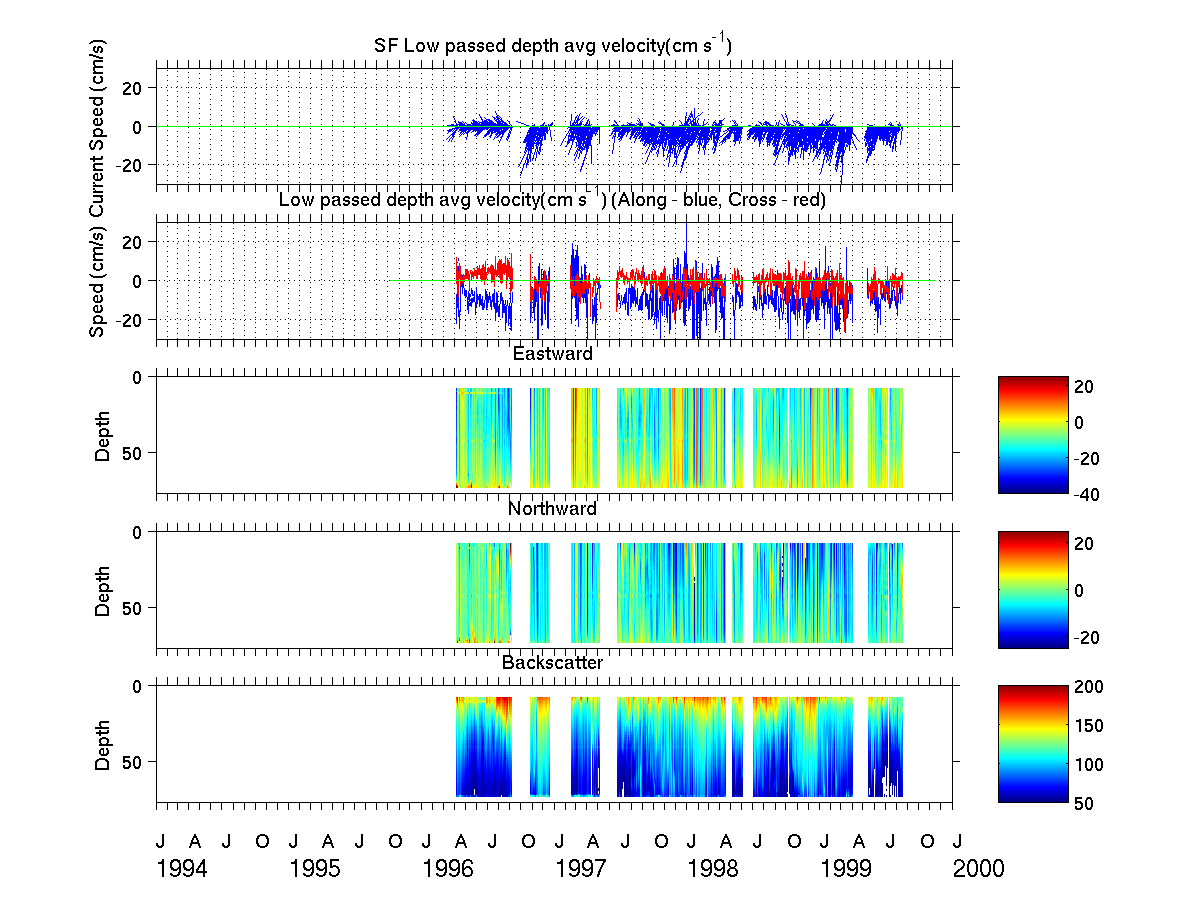
The ADCP pinged at as high a rate as possible with the power available in the ADCP with auxiliary battery pack - 900 pings at 4-second intervals so that the expected uncertainty in the velocity measurement was less that 0.5 cm/sec. The 1-hour (or sometimes 0.5 hour) averaged horizontal velocities were measured in 1-m vertical bins from about 8-m depth to about 10 m above bottom. The loss at the top was due to blanking to remove transducer ringing, and the loss at the bottom was due to sidelobe reflection from the direct downward path to the bottom. The amplitude of the backscattered signal was also recorded in the 1-meter bins and used to monitor the time and depth changes in backscattered signal (related to biological scatterers in the water column). The ADCP also "saw" the instrumentation along the mooring line as side-lobe reflection contamination of the records. This was not apparent in short records (1 week), but becomes obvious with 6-month long record averages. The amplitude of the backscattered signal has an increased level and the Doppler velocities decreased at the depths of the sensors. The decreased velocity estimate is because the signal reflected from the stationary sensors has zero Doppler shift and biases the velocity estimate toward zero. (December 2005 WHOI-2005-11; " U.S. GLOBEC Georges Bank Long-Term Moored Program: Part 1 - Mooring Configuration" by J.D. Irish, S. Kerry, P. Fucile, R.C. Beardsley, J. Lord, and Ken Brink.)
| File |
|---|
NEP_adcp_1997.csv (Comma Separated Values (.csv), 14.73 MB) MD5:7e0958e0487daccc4d841f5b9bef8355 Primary data file for dataset ID 3278 |
| Parameter | Description | Units |
| mooring | mooring identification | |
| year_start | starting year of sampling/operation, GMT | |
| lat | latitude, in decimal degrees, North is positive, negative denotes South | decimal degrees |
| lon | longitude, in decimal degrees, East is positive, negative denotes West | decimal degrees |
| depth_w | water depth | meters |
| depth | sampling depth | meters |
| julian_day | Julian day as a decimal, for reference: Julian day 2440000 begins at 0000 hours, May 23, 1968 | |
| yrday_gmt | GMT day and decimal time, as 326.5 for the 326th day of the year, or November 22 at 1200 hours (noon) | |
| year | year, reported as YYYY, e.g. 1995 | |
| month_gmt | month of year, GMT time , i.e. 1-12 | |
| day_gmt | day, GMT time e.g. 22 | |
| hour_gmt | hours of time, GMT | |
| minute_gmt | minutes of time, GMT | |
| u | eastward velocity | centimeters/second |
| v | northward velocity | centimeters/second |
| w | vertical velocity | centimeters/second |
| Dataset-specific Instrument Name | Acoustic Doppler Current Profiler |
| Generic Instrument Name | Acoustic Doppler Current Profiler |
| Dataset-specific Description | 300-kHz RD Instruments Workhorse ADCP (Acoustic Doppler Current Profiler) |
| Generic Instrument Description | The ADCP measures water currents with sound, using a principle of sound waves called the Doppler effect. A sound wave has a higher frequency, or pitch, when it moves to you than when it moves away. You hear the Doppler effect in action when a car speeds past with a characteristic building of sound that fades when the car passes. The ADCP works by transmitting "pings" of sound at a constant frequency into the water. (The pings are so highly pitched that humans and even dolphins can't hear them.) As the sound waves travel, they ricochet off particles suspended in the moving water, and reflect back to the instrument. Due to the Doppler effect, sound waves bounced back from a particle moving away from the profiler have a slightly lowered frequency when they return. Particles moving toward the instrument send back higher frequency waves. The difference in frequency between the waves the profiler sends out and the waves it receives is called the Doppler shift. The instrument uses this shift to calculate how fast the particle and the water around it are moving. Sound waves that hit particles far from the profiler take longer to come back than waves that strike close by. By measuring the time it takes for the waves to bounce back and the Doppler shift, the profiler can measure current speed at many different depths with each series of pings. (More from WHOI instruments listing). |
NEP_buoy_dep3.3
| Website | |
| Platform | GB NEP Mooring |
| Report | |
| Start Date | 1997-04-12 |
| End Date | 1997-06-29 |
| Description | U.S. GLOBEC Georges Bank Long-Term Moored Program |
NEP_buoy_dep3.2
| Website | |
| Platform | GB NEP Mooring |
| Report | |
| Start Date | 1997-02-17 |
| End Date | 1997-03-06 |
| Description | U.S. GLOBEC Georges Bank Long-Term Moored Program |
U.S. GLOBEC Georges Bank (GB)
The U.S. GLOBEC Georges Bank Program is a large multi- disciplinary multi-year oceanographic effort. The proximate goal is to understand the population dynamics of key species on the Bank - Cod, Haddock, and two species of zooplankton (Calanus finmarchicus and Pseudocalanus) - in terms of their coupling to the physical environment and in terms of their predators and prey. The ultimate goal is to be able to predict changes in the distribution and abundance of these species as a result of changes in their physical and biotic environment as well as to anticipate how their populations might respond to climate change.
The effort is substantial, requiring broad-scale surveys of the entire Bank, and process studies which focus both on the links between the target species and their physical environment, and the determination of fundamental aspects of these species' life history (birth rates, growth rates, death rates, etc).
Equally important are the modelling efforts that are ongoing which seek to provide realistic predictions of the flow field and which utilize the life history information to produce an integrated view of the dynamics of the populations.
The U.S. GLOBEC Georges Bank Executive Committee (EXCO) provides program leadership and effective communication with the funding agencies.
U.S. GLOBal ocean ECosystems dynamics (U.S. GLOBEC)
U.S. GLOBEC (GLOBal ocean ECosystems dynamics) is a research program organized by oceanographers and fisheries scientists to address the question of how global climate change may affect the abundance and production of animals in the sea.
The U.S. GLOBEC Program currently had major research efforts underway in the Georges Bank / Northwest Atlantic Region, and the Northeast Pacific (with components in the California Current and in the Coastal Gulf of Alaska). U.S. GLOBEC was a major contributor to International GLOBEC efforts in the Southern Ocean and Western Antarctic Peninsula (WAP).
| Funding Source | Award |
|---|---|
| National Science Foundation (NSF) | |
| National Oceanic and Atmospheric Administration (NOAA) |
[ table of contents | back to top ]