Water level data from pressure transducer stands at intertidal and subtidal oyster reefs in Wassaw Sound, Georgia in November of 2014 (SensoryNCE project)
Project
| Contributors | Affiliation | Role |
|---|---|---|
| Weissburg, Marc | Georgia Institute of Technology (GA Tech) | Principal Investigator |
| Kubanek, Julia | Georgia Institute of Technology (GA Tech) | Co-Principal Investigator |
| Webster, Donald | Georgia Institute of Technology (GA Tech) | Co-Principal Investigator, Contact |
| York, Amber D. | Woods Hole Oceanographic Institution (WHOI BCO-DMO) | BCO-DMO Data Manager |
This dataset contains water level data from pressure transducer stands at intertidal and subtidal oyster reefs in Wassaw Sound, Georgia from November 3rd to 6th, 2014.
These data were published in Young et al., 2016 (see Fig. 6)
In addition to the "Get data" button above which provides various options to download the data in ASCII format, the originally submitted data in MATLAB .mat format are available as a zip file (Stand_A_D_F_WL.zip, 176 KB)
Sampling Location Map:
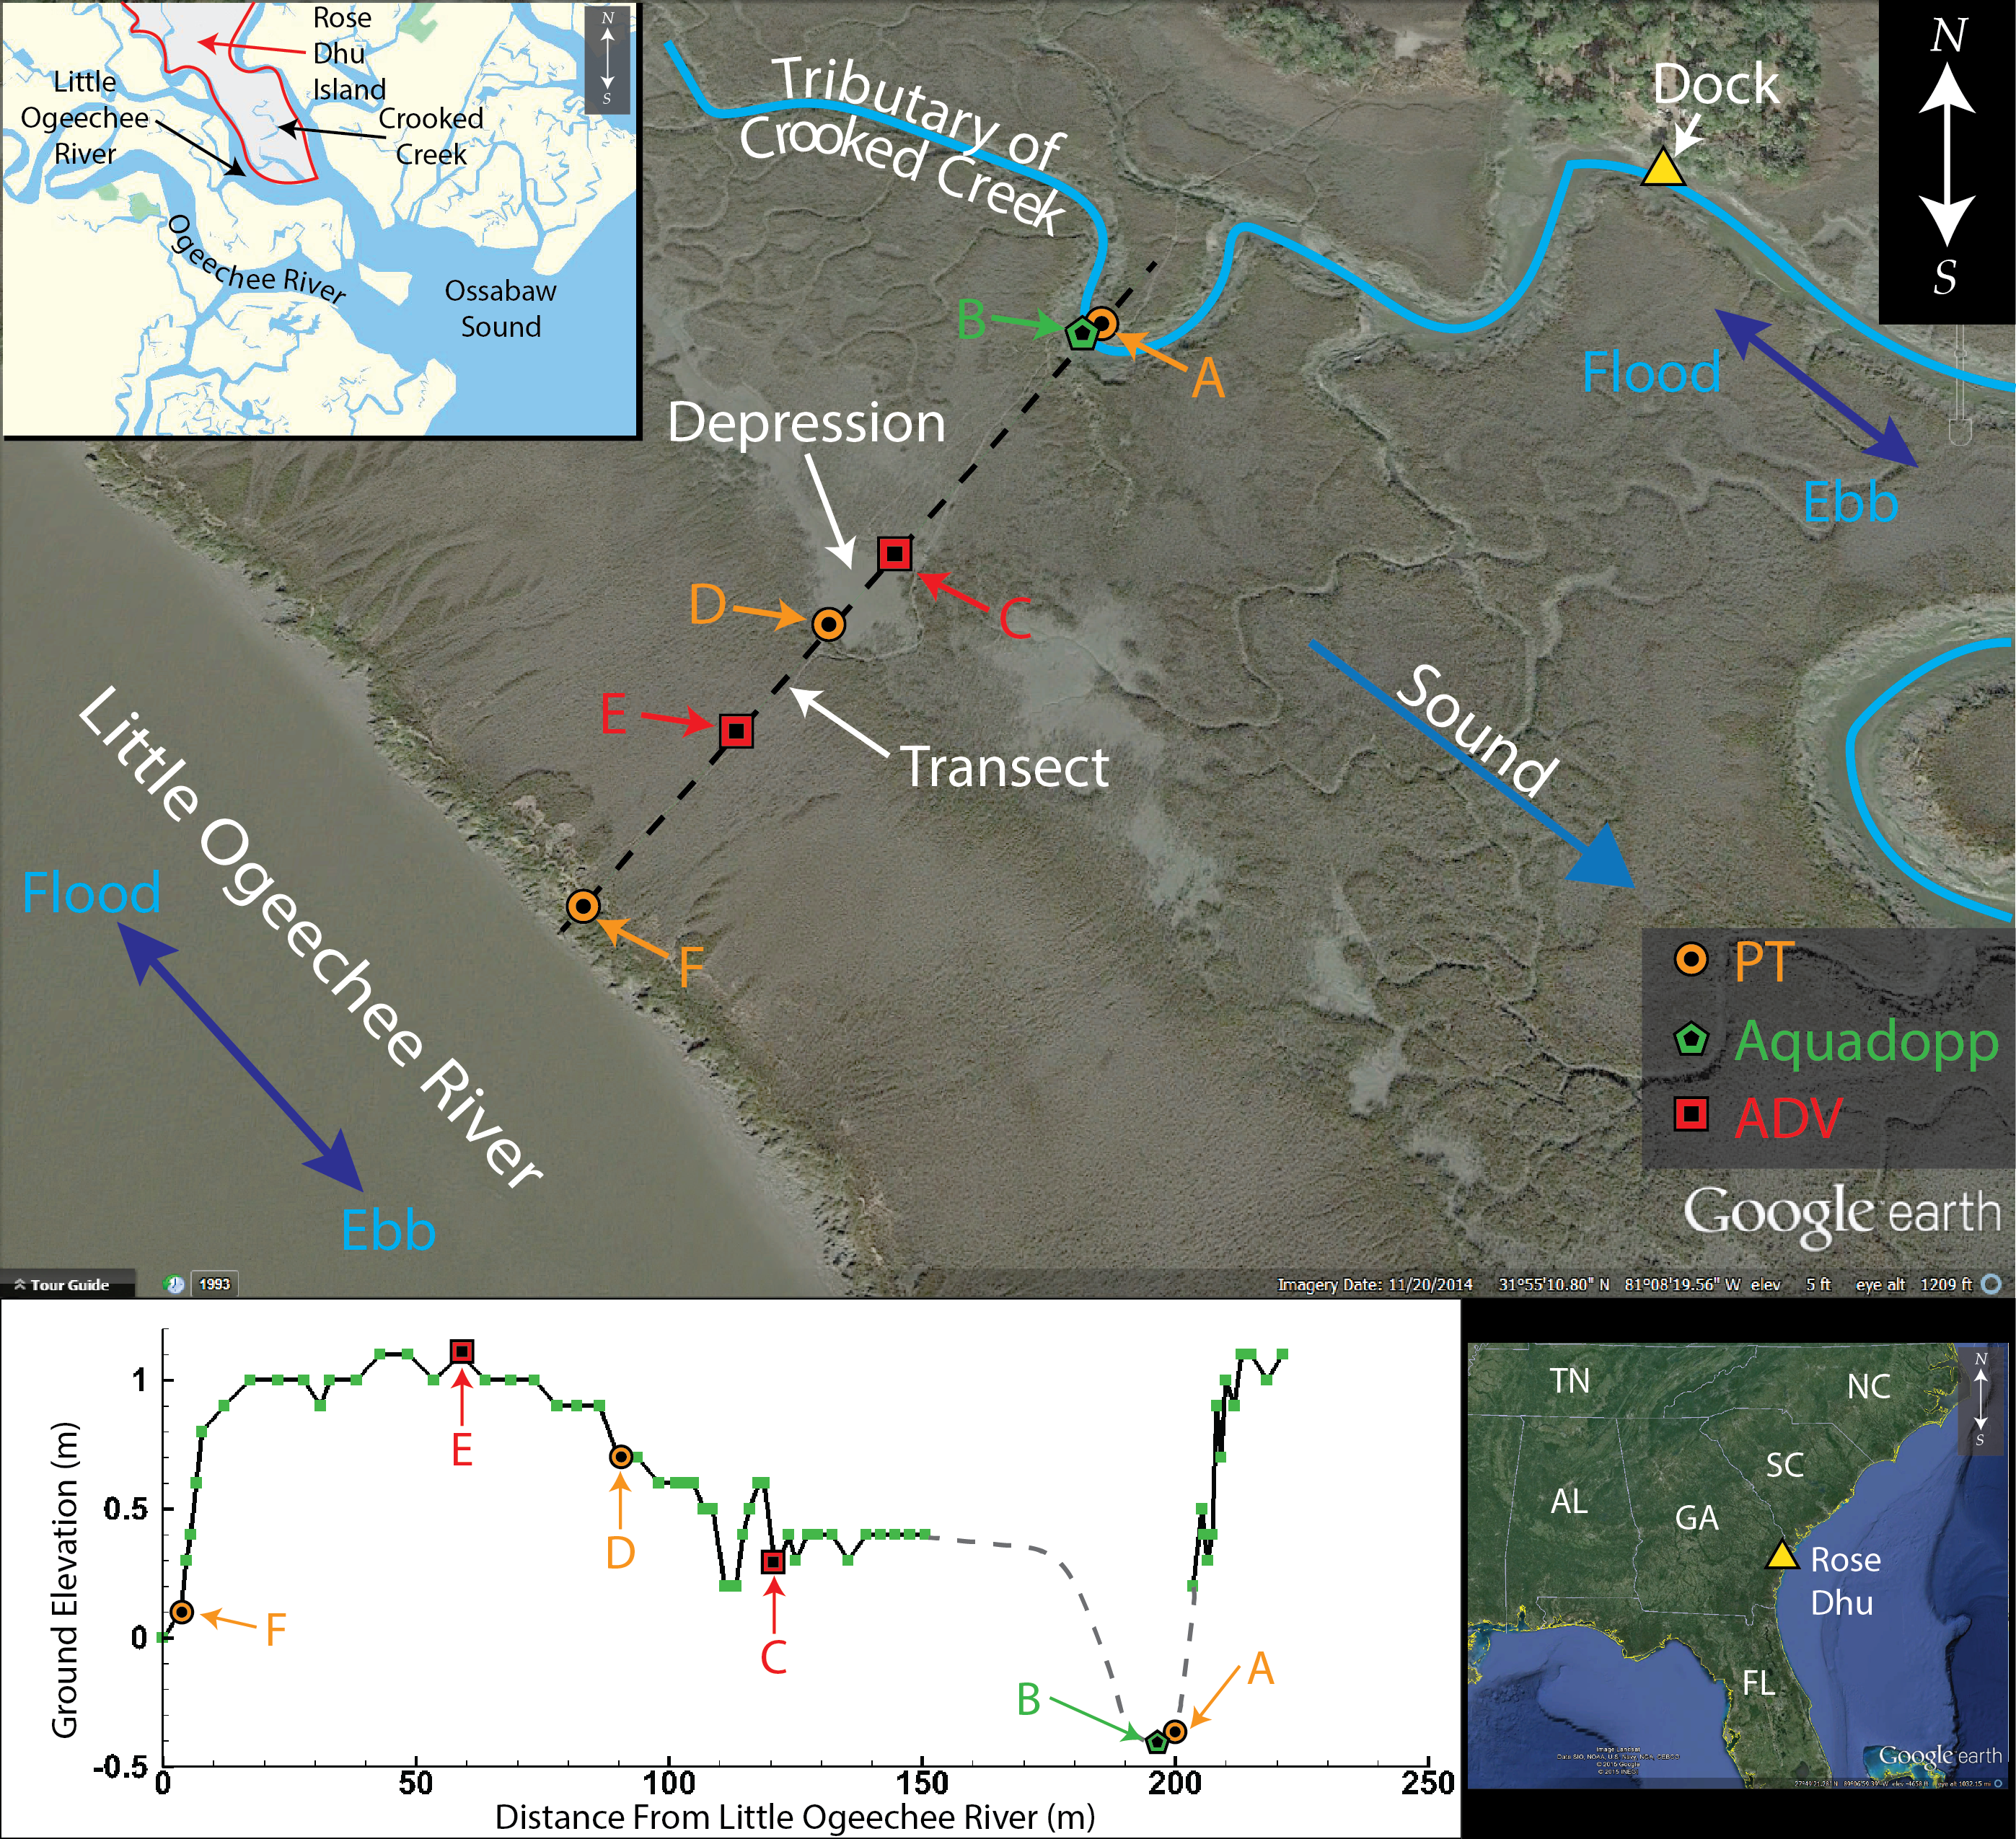
Onset HOBO pressure transducers (PTs) measured absolute pressure and temperature every 30 sec. The PTs were housed in custom-made PVC stands. The stand’s aluminum plate prevented instrument settling during the deployment cycle and the bolt/dive-weight assembly fixed the vertical elevation of the PTs within the stand. The three PTs were surveyed daily with static GPS for at least two hours. Additionally, a GPS base station, located on the nearby fixed dock, was surveyed daily for at least eight hours to improve GPS vertical elevation accuracy during post-processing. The GPS antennae were Ashtech Duel Frequency Marine Antenna (Ashtech S.A.S., Carquefou, France) that were connected to either Ashtech ProFlex 500 GS or Z-Surveyor receivers and were programmed to record internally at 10 sec intervals. The water salinity was measured near the surface from the dock (Fig. 1) at 4:15 PM on November 3rd, 2014 and 11:35 AM on November 6th, 2014 and was 25.7 and 26.3, respectively.
To convert the absolute pressure to gauge pressure, atmospheric pressure readings from the nearby (~ 13 km away) weather station at Skidaway Institute of Oceanography were employed. Gauge pressure was converted to water depth above the PT by assuming the pressure variation in the vertical direction was solely due to hydrostatic effects. The water density was determined from the PT temperature measurement and the salinity measured at the dock, which was assumed to be equal to the salinity in the vicinity of the PTs. Temperature and salinity were assumed to be vertically homogeneous. To improve the accuracy of the absolute pressure readings (and thus the estimated water surface elevation), the three PTs were calibrated in a 1 deep tank at seven temperatures, ranging from 12 to 26 C. Linear calibration curves were developed to calculate the pressure difference between two of the PTs (stations A and D) and the third reference PT (station F) as a function of temperature. These curves were used during data processing to adjust the pressure data to a common reference pressure. The standard deviations of the mean pressure difference between the PTs at stations A and D and the reference PT at station F were calculated for each calibration temperature. The difference was found to be less than Pa in all cases, which corresponded to less than 1 mm of water surface elevation difference. The water surface elevation was calculated relative to the NAVD88 vertical datum by adding the water depth data to the PT elevation using the dimensions of the stand and the GPS measurement of the antenna position. To arrive at sufficiently accurate water surface elevation measurements, the GPS measurements were post-processed using GrafNet (NovAtel, Calgary, Alberta, Canada), treating the GPS system as a stationary closed loop network. The system included four GPS antenna/receivers (one at each PT and one on the dock) and several Continuously Operating Reference Stations (CORS) operated by the U.S. National Geodetic Survey (NGS). The estimated vertical accuracy from GrafNet was approximately 0.5 cm for all stations. This level of accuracy was obtained using simultaneous GPS measurements. The vertical positions of the PT stands did not vary during the experimental periods.
BCO-DMO Data Manager Processing Notes:
* added a conventional header with dataset name, PI name, version date
* data extracted from MATLAB .mat files to ASCII flat files to serve in the BCO-DMO system
* modified parameter names to conform with BCO-DMO naming conventions
* added approximate lat and lon of sampling location to data
* tidal_stage rounded to three decimal places
* Time format changed from matlab datenum to Date and Time (yyyy-mm-dd,HH:MM:SS)
* Data version 2 (2018-07-12) replaces data version 1 (2017-07-20) - improved metadata, added timestamp in UTC in addition to local date/time
| File |
|---|
WaterLevel.csv (Comma Separated Values (.csv), 1.11 MB) MD5:da376e0aca51f35cfdefef98fcb05278 Primary data file for dataset ID 653178 |
| Parameter | Description | Units |
| station | Station identifier; station pressure transducer stand | unitless |
| lat_approx | Approximate sampling latitude | decimal degrees |
| lon_approx | Approximate sampling longitude | decimal degrees |
| date | Date (local EST) in format yyyy-mm-dd | unitless |
| time | Time (local EST) in format HH:MM:SS | unitless |
| tidal_stage | Tidal stage in reference to the North American Vertical Datum of 1988 (NAVD88) | meters |
| ISO_DateTime_UTC | Timestamp (UTC) in standard ISO 8601:2004(E) format YYYY-mm-ddTHH:MM:SSZ | unitless |
| Dataset-specific Instrument Name | an Onset HOBO pressure transducers (PTs) |
| Generic Instrument Name | Temperature Logger |
| Generic Instrument Description | Records temperature data over a period of time. |
SensoryNCE_2014
| Website | |
| Platform | Wassaw_Sound_GA |
| Start Date | 2014-11-03 |
| End Date | 2014-11-06 |
| Description | Wassaw Sound, Georgia |
The role of the sensory environment and predator chemical signal properties in determining NCE strength in cascading interactions on oyster reefs (SensoryNCE)
Extracted from the NSF award abstract:
In this project, the investigators will examine the ability of top blue crab predators to indirectly benefit the abundance of basal oyster prey by reducing the density (consumptive effects, CEs) and suppressing foraging (non-consumptive effects, NCEs) of intermediate mud crab predators. These NCEs are mediated by chemical perception of aversive cues in blue crab urine and produce a behaviorally mediated trophic cascade. Through a series of manipulative experiments, the investigators will examine how the strength of this behaviorally-mediated trophic cascade is modulated and factors that influence perceptive range such as predator diet and intake rate, and the flow environment. The investigators will also determine the chemical identity, concentration and release rate of chemical cues.
Identifying the quantitative and molecular aspects of aversive cues, and linking them to behavioral responses that produce trophic cascades establishes the chemical basis of risk perception by prey and how this translates into cascading ecological effects. The use of perceptive range as a framework for evaluating the effects of both chemistry and environment provides an integrated view of processes affecting chemically-mediated NCEs. The use of a water borne predator-prey signaling system to test ideas on the strength of NCEs should have broad applications.
| Funding Source | Award |
|---|---|
| NSF Division of Ocean Sciences (NSF OCE) |
[ table of contents | back to top ]