Environmental data, nitrifier abundance, ammonia oxidation rates from six from R/V Savannah cruises in the South Atlantic Bight in 2014 (GCE-LTER)
Project
Program
| Contributors | Affiliation | Role |
|---|---|---|
| Hollibaugh, James T. | University of Georgia (UGA) | Principal Investigator, Contact |
| Popp, Brian N. | University of Hawai'i (UH) | Co-Principal Investigator |
| York, Amber D. | Woods Hole Oceanographic Institution (WHOI BCO-DMO) | BCO-DMO Data Manager |
This dataset contains the gene concentration of Thaumarchaeota and Bacteria 16S rRNA; Archaea and betaproteobacteria ammonia monooxygenase subunit A (amoA); and Nitrospina 16S rRNA. It also contains ammonia oxidation rates, and environmental data; temperature, salinity, PAR, dissolved oxygen, chlorophyll a, and fluorescence. Samples were collected using Niskin bottles mounted on a CTD rosette during R/V Savannah cruises to the Southern Atlantic Bight in 2014.
Sampling
Samples were collected on 6 cruises of the R/V Savannah across the SAB (2-6 April, 15-18 May, 15-19 July, 4-7 Aug, 23-30 Sept and 3-7 Nov of 2014). The stations were divided into four regions: inshore, nearshore, mid-shelf and shelf-break, based on their locations and physical properties (Atkinson et al 1985). Station C8 is on the edge of the shelf-break and is influenced by intrusions of the Gulf Stream; thus, C8 was considered as a shelf-break station in this study. Surface and bottom water samples were collected from all stations, but we also collected samples at depths of 75 (or 100) m and 200 m at shelf-break stations C9 and C10. Seawater samples were collected using 12 L Niskin bottles mounted on a CTD rosette. Profiles of environmental variables (temperature, salinity, dissolved oxygen, relative fluorescence) were taken by sensors mounted on the CTD during hydrocasts to collect water samples. Optical Backscatter measured with a Wetlabs ECO BB Backscatter sensor at a wavelength of 660 nm.
Approximately 1L of water from each station and depth sampled was filtered through 0.22 um pore size Durapore filters (Millipore). The filters were then placed in Whirl-Pak bags, 2 mL of lysis buffer (0.75 M sucrose, 40 mM EDTA, 50 mM Tris; pH=8.3) was added, and the filters were frozen on dry ice and stored at -80C until they were processed. DNA was extracted from filters by first lysing cells with lysozyme and sodium dodecyl sulfate/proteinase K, followed by a phenol-chloroform extraction as described previously (Bano and Hollibaugh 2000, Tolar et al 2013). Approximately 100 mL of the filtrate was frozen at -20C for nutrient analysis (NO2, NO3, NH4, and urea). Ammonium was measured using a fluorometric method described in (Holmes et al 1999). Nitrate plus nitrite (NOx) was analyzed by reducing nitrate to nitrite with cadmium (Jones 1984), and nitrite was determined following (Strickland and Parsons 1972). Urea was measured following (Mulvenna and Savidge 1992) and (Revilla et al 2005). A total of ~1 L of seawater was filtered through 47 mm diameter Whatman GF/C glass fiber filters to collect chlorophyll a during all cruises except May. Two or three drops (~0.1 to 0.2 mL) of magnesium carbonate (0.01 g/mL) were added to the sample at the end of the filtration to avoid degradation to pheophytin. Filters were wrapped in aluminum foil and stored at -20C until processed. Chlorophyll a was extracted in 90% acetone and measured spectrophotometrically as described in (Strickland and Parsons 1972).
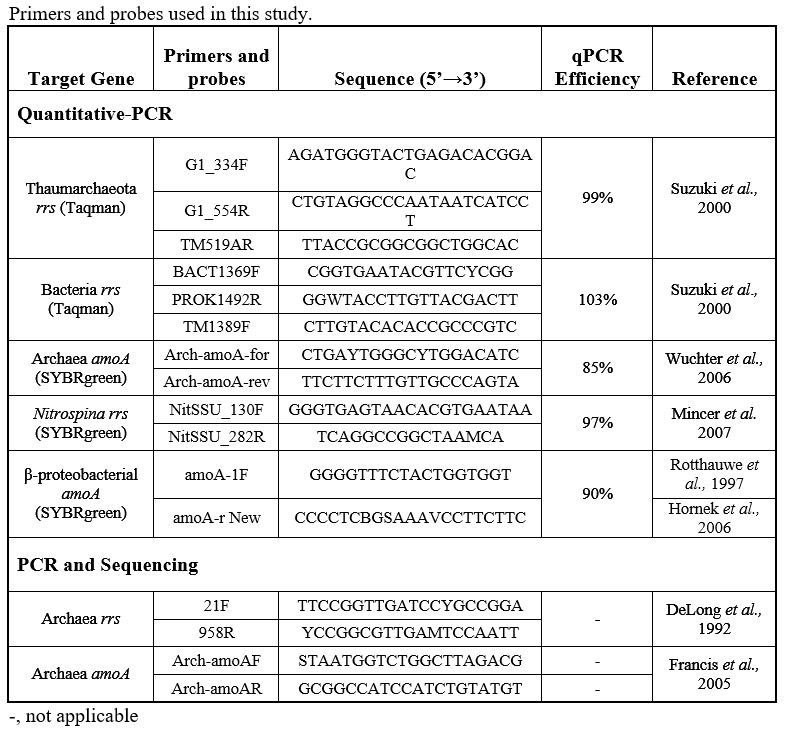
Quantitative PCR. All quantitative PCR (qPCR) analyses were performed on a C1000 TouchTM Thermal cycler (Bio-Rad Laboratories, Hercules, CA). qPCR reactions were run in triplicate with a dilution series of standards made from environmental amplicons as described in (Kalanetra et al 2009) and (Tolar et al 2013). We determined the abundance (copies/L) of Thaumarchaeota and Bacteria 16S rRNA genes (rrs); Archaea and betaproteobacteria amoA genes; and Nitrospina 16S rRNA (rrs) genes. Thaumarchaeota and Bacteria rrs were detected using TaqMan probes and iTaq Universal Probes Super Mix (Bio-Rad), while all other genes were quantified using SYBRgreen (iTaq Universal SYBRgreen Supermix, Bio-Rad). The primers and probes used and resulting qPCR efficiencies are given in the table below. Note that Archaea amoA was quantified using the (Wuchter et al 2006) primer set, which is biased against amoA genes from the deep-water clade of AOA (Beman et al 2008, Tolar et al 2013) that we encountered at shelf-break stations. Thaumarchaeota abundance was calculated from gene abundance (copies per liter assuming 100% extraction efficiency, calculated from copies per reaction, volume filtered for each sample, extract volume and the volume of template used in each reaction), assuming one rrs or amoA gene per Thaumarchaeota genome (IMG database). The relative abundance of Thaumarchaeota (percent of prokaryotes) was calculated assuming 1.8 rrs per Bacteria genome (Biers et al 2009) as described in (Kalanetra et al 2009).
Ammonia oxidation (AO) rates. AO rates were measured in 24 h incubations at in situ temperatures in the dark using15N-labeled ammonium (>99 atom-percent 15NH4Cl; Cambridge Isotope Laboratories, Tewksbury, MA) added to a final concentration of 50 nM. Incubations were terminated by freezing at -20 °C. Controls were frozen immediately after the addition of 15NH4Cl. The 15NOx produced was measured using the “denitrifier method” (Sigman et al 2001) as described previously (Beman et al 2012, Dore et al 1998, Popp et al 1995). Briefly, 15N2O produced from NO2- and NO3- by incubation with the denitrifier Pseudomonas aureofaciens cultures was transferred from a reaction vial, cryofocused, separated from other gases using a 0.32-mm i.d. × 25 m capillary column packed with 5 µm CP-PoraBOND Q (Agilent Technologies, Santa Clara, CA) at room temperature, and introduced into a Finnigan MAT-252 isotope ratio mass spectrometer (Thermo Fisher Scientific, Waltham, MA). 15N2O concentrations and d15N were determined to calculate the AO rates with a modified equation described previously (Beman et al 2011, Beman et al 2012, Ward et al 1989).
LITERATURE CITED
Atkinson LP, Menzel DW, Bush KA (eds) (1985) Oceanography of the Southeastern US Continental Shelf. AGU: Washington D.C., 156pp.
Bano N, Hollibaugh JT (2000). Diversity and distribution of DNA sequences with affinity to ammonia-oxidizing bacteria of the ß-subdivision of the Class Proteobacteria in the Arctic Ocean. Appl Environ Microbiol 66: 1960-1969.
Beman JM, Popp BN, Francis CA (2008). Molecular and biogeochemical evidence for ammonia oxidation by marine Crenarchaeota in the Gulf of California. ISME J 2: 429-441.
Beman JM, Chow C-E, King AL, Feng Y, Fuhrman JA, Andersson A et al (2011). Global declines in oceanic nitrification rates as a consequence of ocean acidification. Proceedings of the National Academy of Sciences 108: 208-213.
Beman JM, Popp BN, Alford SE (2012). Quantification of ammonia oxidation rates and ammonia-oxidizing archaea and bacteria at high resolution in the Gulf of California and eastern tropical North Pacific Ocean. Limnology and Oceanography 57: 711-726.
Biers EJ, Sun S, Howard EC (2009). Prokaryotic genomes and diversity in the surface ocean: interrogating the Global Ocean Sampling metagenome. Appl Environ Microbiol 75: 2221-2229.
Dore JE, Popp BN, Karl DM, Sansone FJ (1998). A large source of atmospheric nitrous oxide from subtropical North Pacific surface waters. Nature 396: 63-66.
Drummond AJ, Ashton B, Buxton S, Cheung M, Cooper A, Duran C et al (2012). Geneious, 5.6 edn. Biomatters Inc.: Auckland, NZ.
Holmes RM, Aminot A, Kerouel R, Hooker BA, Peterson BJ (1999). A simple and precise method for measuring ammonium in marine and freshwater ecosystems. Canadian Journal of Fisheries and Aquatic Science 56: 1801-1808.
Jones MN (1984). Nitrate reduction by shaking with cadmium: alternative to cadmium columns. Water Res 18: 643-646.
Kalanetra KM, Bano N, Hollibaugh JT (2009). Ammonia-oxidizing Archaea in the Arctic Ocean and Antarctic coastal waters. Environmental Microbiology 11: 2434–2445.
Legendre P, Legendre L (1998). Numerical Ecology, 2nd English edition edn. Elsevier Science BV: Amsterdam.
Mulvenna PF, Savidge G (1992). A modified manual method for the determination of urea in seawater using diacetylmonoxime reagent. Estuar Coastal Shelf Sci 34: 429-438.
Popp BN, Sansone FJ, Rust TM, Merritt DA (1995). Determination of concentration and carbon isotopic composition of dissolved methane in sediments and nearshore waters. Analytical Chemistry 67: 405-411.
Revilla M, Alexander J, Glibert PM (2005). Urea analysis in coastal waters: comparison of enzymatic and direct methods. Limnol Oceanogr Methods 3: 290–299.
Sigman DM, Casciotti KL, Andreani M, Barford C, Galanter M, Bohlke JK (2001). A bacterial method for the nitrogen isotopic analysis of nitrate in seawater and freshwater. Analytical Chemistry 73: 4145-4153.
Strickland JDH, Parsons TR (1972). A Practical Handbook of Seawater Analysis. Second Edition 2edn, vol. Bulletin 167. Fisheries Research Board of Canada: Ottawa.
Ter Braak CJF, Smilauer P (2002). CANOCO Reference manual and CanoDraw for Windows User’s guide: Software for Canonical Community Ordination, 4.5 edn. Microcomputer Power: Ithica, USA.
Tolar BB, King GM, Hollibaugh JT (2013). An analysis of Thaumarchaeota populations from the Northern Gulf of Mexico. Frontiers in Microbiology 4: 72.
Ward BB, Kilpatrick KA, Renger E, Eppley RW (1989). Biological nitrogen cycling in the nitracline. Limnology and Oceanography 34: 493-513.
Wuchter C, Abbas B, Coolen MJL, Herfort L, van Bleijswijk J, Timmers P et al (2006). Archaeal nitrification in the ocean. Proceedings of the National Academy of Sciences of the USA 103: 12317-12322.
Zhang Z, Schwartz S, Wagner L, Miller W (2000). A greedy algorithm for aligning DNA sequences. Journal of Computational Biology 7: 203-214.
Temperature and Conductivity were used to calculate salinity (SeaBird software).
Relative Fluorescence data were converted to chlorophyll a equivalents using a regression based on measured chlorophyll a.
Daytime PAR data from the LiCor sensor on the rosette were log transformed and the PAR attenuation coefficient (per meter) was derived from linear regressions of log(PAR) versus depth, discarding noisy points at the top of the profile or points in the shadow of the ship’s hull.
Optical backscatter (OBS):
Output recorded by the CTD was calibrated to Nephelometric Turbidity Unit (NTU) then multiplied by 100 in this dataset. OBS data were plotted against the PAR attenuation coefficients derived for the same hydrocasts and with a reasonable linear fit (scattergram) up to OBS limit (18.5 mV). The upper limit for the response of the sensor was 18.5 mV, regardless of the actual turbidity of the water. Data from each cast was evaluated by inspection and unless there was an anomaly in the data, the value reported is the mean of the first 100 unbinned records in the downcast. For calibration information see the ECO-BB calibration (PDF).
Station identifier acronyms:
SA is Saint Andrews Sound,
ALTES, DOBES and SAPES are stations withing the estuary
Inclusion of HW and LW indicate high versus low tide
CRA are a participant's initials
SC is Saint Catherines Sound
SS is Saint Simon's Sound
OS is Ossabaw Sound
WS is Wassaw Sound
MK### are channel markers in the Intracoastal Waterway, and letters followed by numbers are offshore transects with lowest number being closest to the shore.
BCO-DMO Data Manager Processing Notes:
* added a conventional header with dataset name, PI name, version date
* modified parameter names to conform with BCO-DMO naming conventions
* blank values replaced with no data value 'nd'
* ISO DateTime added from date and time values
* replaced spaces in station name with underscores
* data version 2017-03-27 is an update of version 2017-02-02. Added optical backscatter
* removed parentheses from Station 136 (B) changed to 136B in stations names
* data version 2017-04-26 is an update of version 2017-03-27 which fills in optical backscatter gaps in April and November of 2014.
| File |
|---|
env_etc.csv (Comma Separated Values (.csv), 60.73 KB) MD5:7685930f002bf17b7cf00f81487fd600 Primary data file for dataset ID 680082 |
| Parameter | Description | Units |
| ISO_DateTime_UTC | ISO timestamp based on the ISO 8601:2004(E) standard in format YYYY-mm-ddTHH:MM:SSZ (UTC) | unitless |
| lat | Latitude of sample; north is positive | decimal degrees |
| lon | Longitude of sample; west is negative | decimal degrees |
| cruise_id | Cruise identifier (R2R) | unitless |
| date | Sampling date (UTC) in format yyyy-mm-dd | unitless |
| time | Sampling time (UTC) in format hh:mm | unitless |
| station | Station identifier; see metadata description for acronym meanings | unitless |
| cast | CTD cast identifier | unitless |
| depth | Depth of sample | meters |
| zone | Zone identifier: I = Inshore; N = Nearshore; M = midshelf; S = Shelf-break | unitless |
| fluor | Relative fluorescence measured by the fluorometer on the Niskin rosette sampler converted to mg Chl a L-1 using a regression equation based on extracted chlorophyll data: chl a = 1.7869RF - 2.2541; R^2 = 0.83 | miligrams per meter cubed (mg/m3) |
| chl | Chlorophyll a concentration | micrograms per liter (ug/L) |
| PAR | PAR attenuation coefficient (Kz) calculated as the slope of log(PAR) vs depth | per meter (m-1) |
| O2 | Dissolved oxygen concentration from the oxygen sensor on the ship's CTD | miligrams per liter (mg/L) |
| temp | Water temperature from the CTD | degrees Celsius |
| sal | Salinity calculated from condictivity from the ship's CTD | practical salinity units (PSU) |
| arch_amoA | Concentration of genes for Archaeal ammonia monooxygenase subunit A determined by qPCR | 10^6 copies per liter |
| crecarch_rrs | Concentration of genes for Marine Group 1 Archaea (Thaumarchaeota) 16S rRNA determined by qPCR | 10^6 copies per liter |
| betapro_amoA | Concentration of genes for Betaproteobacteria ammonia monooxygenase subunit A determined by qPCR | 10^3 copies per liter |
| bacteria_rrs | Concentration of genes for Bacteria 16S rRNA determined by qPCR | 10^9 copies per liter |
| nitrospina_rrs | Concentration of genes for Nitrospina 16S rRNA determined by qPCR | 10^6 copies per liter |
| diatom_rrs | Concentration of genes for diatom 18S rRNA determined by qPCR | 10^9 copies per liter |
| ammonia_ox_rate | Ammonia oxidation rate determined from conversion of 15N-labeled ammonium to 15N-labeled nitrite plus nitrate | nanomoles per liter per day (nmol/L/d) |
| nitrite | Nitrite concentration | 10^6 moles per liter |
| nitrite_plus_nitrate | Nitrite plus nitrate concentration | 10^6 moles per liter |
| ammonium | Ammonium concentration | 10^6 moles per liter |
| urea | Urea concentration | 10^6 moles per liter |
| opt_bs | Optical backscatter; raw output. See processing description for more details. | millivolts (mV) |
| Dataset-specific Instrument Name | Finnigan MAT-252 |
| Generic Instrument Name | Mass Spectrometer |
| Dataset-specific Description | Finnigan MAT-252 isotope ratio mass spectrometer (Thermo Fisher Scientific, Waltham, MA) |
| Generic Instrument Description | General term for instruments used to measure the mass-to-charge ratio of ions; generally used to find the composition of a sample by generating a mass spectrum representing the masses of sample components. |
| Dataset-specific Instrument Name | |
| Generic Instrument Name | Niskin bottle |
| Generic Instrument Description | A Niskin bottle (a next generation water sampler based on the Nansen bottle) is a cylindrical, non-metallic water collection device with stoppers at both ends. The bottles can be attached individually on a hydrowire or deployed in 12, 24, or 36 bottle Rosette systems mounted on a frame and combined with a CTD. Niskin bottles are used to collect discrete water samples for a range of measurements including pigments, nutrients, plankton, etc. |
| Dataset-specific Instrument Name | ECO BB |
| Generic Instrument Name | Optical Backscatter Sensor |
| Dataset-specific Description | For calibration, see spreadsheet file ECO_BB_calibration (PDF) |
| Dataset-specific Instrument Name | |
| Generic Instrument Name | Sea-Bird SBE 25 Sealogger CTD |
| Generic Instrument Description | The Sea-Bird SBE 25 SEALOGGER CTD is battery powered and is typically used to record data in memory, eliminating the need for a large vessel, electrical sea cable, and on-board computer. All SBE 25s can also operate in real-time, transmitting data via an opto-isolated RS-232 serial port. Temperature and conductivity are measured by the SBE 3F Temperature sensor and SBE 4 Conductivity sensor (same as those used on the premium SBE 9plus CTD). The SBE 25 also includes the SBE 5P (plastic) or 5T (titanium) Submersible Pump and TC Duct. The pump-controlled, TC-ducted flow configuration significantly reduces salinity spiking caused by ship heave, and in calm waters allows slower descent rates for improved resolution of water column features. Pressure is measured by the modular SBE 29 Temperature Compensated Strain-Gauge Pressure sensor (available in eight depth ranges to suit the operating depth requirement). The SBE 25's modular design makes it easy to configure in the field for a wide range of auxiliary sensors, including optional dissolved oxygen (SBE 43), pH (SBE 18 or SBE 27), fluorescence, transmissivity, PAR, and optical backscatter sensors. More information from Sea-Bird Electronics: http:www.seabird.com. |
| Dataset-specific Instrument Name | C1000 Touch Thermal cycler |
| Generic Instrument Name | Thermal Cycler |
| Dataset-specific Description | C1000 Touch Thermal cycler (Bio-Rad Laboratories, Hercules, CA) |
| Generic Instrument Description | A thermal cycler or "thermocycler" is a general term for a type of laboratory apparatus, commonly used for performing polymerase chain reaction (PCR), that is capable of repeatedly altering and maintaining specific temperatures for defined periods of time. The device has a thermal block with holes where tubes with the PCR reaction mixtures can be inserted. The cycler then raises and lowers the temperature of the block in discrete, pre-programmed steps. They can also be used to facilitate other temperature-sensitive reactions, including restriction enzyme digestion or rapid diagnostics.
(adapted from http://serc.carleton.edu/microbelife/research_methods/genomics/pcr.html) |
SAV-14-08
| Website | |
| Platform | R/V Savannah |
| Start Date | 2014-04-02 |
| End Date | 2014-04-16 |
SAV-14-11
| Website | |
| Platform | R/V Savannah |
| Start Date | 2014-05-14 |
| End Date | 2014-05-19 |
SAV-14-18
| Website | |
| Platform | R/V Savannah |
| Start Date | 2014-07-15 |
| End Date | 2014-07-29 |
SAV-14-19
| Website | |
| Platform | R/V Savannah |
| Start Date | 2014-08-04 |
| End Date | 2014-08-08 |
SAV-14-23
| Website | |
| Platform | R/V Savannah |
| Start Date | 2014-09-23 |
| End Date | 2014-10-07 |
SAV-14-28
| Website | |
| Platform | R/V Savannah |
| Start Date | 2014-11-03 |
| End Date | 2014-11-08 |
Georgia Coastal Ecosystems Long Term Ecological Research site (GCE LTER)
Adapted (2015) from http://gce-lter.marsci.uga.edu/
Site description: The Georgia Coastal Ecosystems Long Term Ecological Research site (GCE) was established by the National Science Foundation in 2000. The study domain encompasses three adjacent sounds (Altamaha, Doboy, Sapelo) on the coast of Georgia, U.S.A., and includes upland (mainland, barrier islands, marsh hammocks), intertidal (fresh, brackish and salt marsh) and submerged (river, estuary, continental shelf) habitats.
Patterns and processes in this complex landscape vary spatially within and between sites, and temporally on multiple scales (tidal, diurnal, seasonal, and inter-annual). Overlain on this spatial and temporal variation are long-term trends caused by climate change, sea level rise, and human alterations of the landscape. These long-term trends are likely to manifest in many ways, including changes in water quality, river discharge, runoff and tidal inundation patterns throughout the estuarine landscape.
Research Context: Over the coming decades, the Georgia coast is expected to experience substantial changes due to factors such as climate change, sea level rise, and human alterations of the landscape that will cause transitions in dominant habitat types (state changes) within the GCE domain by changing the amounts and patterns of water delivery across the landscape. The overarching goal of the GCE LTER is to understand the mechanisms by which variation in the quality, source and amount of both fresh and salt water create temporal and spatial variability in estuarine habitats and processes, in order to predict directional changes that will occur in response to long-term shifts in estuarine salinity patterns.
Program Information: The GCE field site is based at the University of Georgia Marine Institute on Sapelo Island, and the program is administered at the University of Georgia Department of Marine Sciences in Athens, Georgia. Over 60 participants, representing 14 academic institutions and agencies, are currently involved in GCE research and educational programs. The GCE Information Management System (see the Data URL above) provides online access to hundreds of core data sets, ancillary data sets from partner agencies, a searchable document and imagery archive, and a searchable bibliography of over 1400 publications from 50 years of research on the Georgia coast and Sapelo Island.
LTER Data: The Georgia Coastal Ecosystem (GCE) LTER data are managed by and available directly from the GCE project data site URL shown above. If there are any datasets listed below, they are data sets that were collected at or near the GCE LTER sampling locations, and funded by NSF OCE as ancillary projects related to the GCE LTER core research themes.
This project is supported by continuing grants with slight name variations:
- LTER - Georgia Land/Ocean Margin Ecosystem
- LTER: Georgia Coastal Ecosystems-II
- LTER: Georgia Coastal Ecosystems-III
Long Term Ecological Research network (LTER)
adapted from http://www.lternet.edu/
The National Science Foundation established the LTER program in 1980 to support research on long-term ecological phenomena in the United States. The Long Term Ecological Research (LTER) Network is a collaborative effort involving more than 1800 scientists and students investigating ecological processes over long temporal and broad spatial scales. The LTER Network promotes synthesis and comparative research across sites and ecosystems and among other related national and international research programs. The LTER research sites represent diverse ecosystems with emphasis on different research themes, and cross-site communication, network publications, and research-planning activities are coordinated through the LTER Network Office.

2017 LTER research site map obtained from https://lternet.edu/site/lter-network/
| Funding Source | Award |
|---|---|
| NSF Division of Ocean Sciences (NSF OCE) | |
| NSF Division of Ocean Sciences (NSF OCE) |
[ table of contents | back to top ]