CTD data from McMurdo Sound, Antarctica from 2012 to 2015 (McMurdo Predator Prey project)
Project
| Contributors | Affiliation | Role |
|---|---|---|
| Daly, Kendra L. | University of South Florida (USF) | Principal Investigator, Contact |
| Ainley, David G. | H.T. Harvey & Associates | Co-Principal Investigator |
| Ballard, Grant | Point Blue Conservation Science | Co-Principal Investigator |
| Kim, Stacy | Moss Landing Marine Laboratories (MLML) | Co-Principal Investigator |
| York, Amber D. | Woods Hole Oceanographic Institution (WHOI BCO-DMO) | BCO-DMO Data Manager |
This dataset includes temperature, salinity, conductivity, oxygen, depth, sound velocity, chlorophyll fluorescence, and pH measurements from McMurdo Sound, Antarctica. Data were collected by CTD, fluorescence, and pH sensors during austral years 2012/2013 and 2014/2015
A small hole was drilled in the McMurdo Sound fast ice. The CTD was deployed below the fast ice to ~ 2 m depth. The CTD was then powered on and allowed to sit a few minutes until the pumps turned on and sensors stabilized and equilibrated. The CTD was then lowered using a hand winch to depths between 97 and 175 m.
These data are not quality controlled. The oxygen sensor failed at some point during both 2012 and 2014. The conductivity sensor calibrations did not show significant drift, however, a bad cable in 2014 likely caused intermittent data spikes.
There are no fluorescence values in these data for 2012 and the beginning of 2014. The first station with fluorescence is station 108 in 2014. There are no pH values in the 2014 data.
Raw data were saved as hex files and converted to 1 m bin averaged data using the Sea-Bird Electronics Inc. Data Processing Software v.7.23.1. For calibration and instrument information please consult the CTD header files (ZIP, 131 files, 440 KB total). The header files contain header lines generated by Sea-Bird processing software for each cast.
The "Parameter" section of this dataset landing page provides the data parameter names currently used in this data version as well as the original name used in the Sea-Bird Data Processing Software.
BCO-DMO Data Manager Processing Notes:
* added a conventional header with dataset name, PI name, version date
* modified parameter names to conform with BCO-DMO naming conventions
* blank values replaced with no data value 'nd'
* data from Jan 02 2013 15:00 had some trailing commas and/or extra values at end of lines (0.0). Characters after the last comma were removed.
* v0 Voltage 0 was duplicated with same variable name, values, and description. Removed second instance
* For station 212, austral season 2014 the time was in elapsed seconds so added the time in hh:mm instead to match other files. Got the time from a date time string column (timeJ) in the original file.
* Date format converted to ISO Date format (source timeJ)
* Data version 2017-05-04 is an update of version 2017-02-08 that includes variable name changes in the data and a timestamp change from local to UTC. Time and date now called time_local, date_local. Other variables are now more descriptive for example "depSM" is now "depth." Added time zone offset parameter.
| File |
|---|
ctds.csv (Comma Separated Values (.csv), 6.08 MB) MD5:6d4ed640afc81e793b723b86f0021216 Primary data file for dataset ID 680929 |
| Parameter | Description | Units |
| austral_year | Austral season sampled | unitless |
| station | Sampling station identifier | unitless |
| cast | CTD cast identifier | unitless |
| lat | Latitude of sample; north is positive | decimal degrees |
| lon | Longitude of sample; west is negative | decimal degrees |
| depth | Depth of sample. Originally named "depSM." | meters |
| ISO_DateTime_UTC | ISO timestamp based on the ISO 8601:2004(E) standard in format YYYY-mm-ddTHH:MM:SS[.xx]Z (UTC) | unitless |
| date_local | Local date in format yyyy-mm-dd | unitless |
| time_local | Local time in format hh:mm:ss | unitless |
| time_zone_offset | Time offset in hours from UTC to local time at McMurdo Station. | unitless |
| temp | Temperature (ITS-90). Originally named "tv290C." | degrees Celsius |
| potemp | Primary potential temperature (ITS-90). Originally named "potemp090C." | degrees Celsius |
| sal | Salinity. Originally named "sal00." | practical salinity unit (PSU) |
| cond_S_m | Conductivity. Originally named "c0S/m." | Siemens per meter (S/m) |
| cond_mS_cm | Conductivity. Originally named "c0mS/cm." | millisiemens per centimeter (mS/cm) |
| density | Density. Originally named "density00." | kilograms per meter cubed (kg/m^3) |
| sigma_theta | Sigma-theta density. Originally named "sigma_e00." | kilograms per meters cubed |
| sigma_t | Sigma-t density. Originally named "sigma_t00." | kilograms per meters cubed |
| press | Pressure (Strain Gauge). Originally named "prdM." | decibars (db) |
| O2_mL_L | Dissolved oxygen. Originally named "sbeox0ML/L." | milliliters per liter (ml/l) |
| O2_mg_L | Dissolved oxygen. Originally named "sbeox0Mg/L." | milligrams per liter (mg/l) |
| O2_umol_kg | Dissolved oxygen. Originally named "sbeox0Mm/Kg." | micromoles per kilogram (umol/kg) |
| O2_sat | Oxygen saturation. Originally named "sbeox0PS." | percent |
| fluor | Fluorescence (from WET Labs ECO-AFL/FL). Originally named "flECO-AFL." | milligrams per meter cubed (mg/m^3) |
| pH | pH. Originally named "ph." | pH units |
| flag | Quality flag | unitless |
| sound_vel_CM | Sound velocity. Calculated using Chen and Millero (1977) formula. Originally named "svCM." | meters per second |
| sound_vel_DM | Sound velocity. Calculated using Del Grosso (1974) formula. Originally named "svDM." | meters per second |
| sound_vel_WM | Sound velocity. Calculated using Wilson (1960) formula. Originally named "svWM." | meters per second |
| avg_sound_vel_CM | Average sound velocity. Calculated using Chen and Millero (1977) formula. Originally named "avgsvCM." | meters per second |
| avg_sound_vel_DM | Average sound velocity. Calculated using Del Grosso (1974) formula. Originally named "avgsvDM." | meters per second |
| avg_sound_vel_WM | Average sound velocity. Calculated using Wilson (1960) formula. Originally named "avgsvWM." | meters per second |
| Dataset-specific Instrument Name | Seabird SBE 19 Plus |
| Generic Instrument Name | CTD Sea-Bird SBE SEACAT 19plus |
| Generic Instrument Description | Self contained self powered CTD profiler. Measures conductivity, temperature and pressure in both profiling (samples at 4 scans/sec) and moored (sample rates of once every 5 seconds to once every 9 hours) mode. Available in plastic or titanium housing with depth ranges of 600m and 7000m respectively. Minature submersible pump provides water to conductivity cell. |
| Dataset-specific Instrument Name | |
| Generic Instrument Name | Niskin bottle |
| Generic Instrument Description | A Niskin bottle (a next generation water sampler based on the Nansen bottle) is a cylindrical, non-metallic water collection device with stoppers at both ends. The bottles can be attached individually on a hydrowire or deployed in 12, 24, or 36 bottle Rosette systems mounted on a frame and combined with a CTD. Niskin bottles are used to collect discrete water samples for a range of measurements including pigments, nutrients, plankton, etc. |
| Dataset-specific Instrument Name | Sea-Bird SBE-27 pH sensor |
| Generic Instrument Name | pH Sensor |
| Generic Instrument Description | An instrument that measures the hydrogen ion activity in solutions.
The overall concentration of hydrogen ions is inversely related to its pH. The pH scale ranges from 0 to 14 and indicates whether acidic (more H+) or basic (less H+). |
| Dataset-specific Instrument Name | |
| Generic Instrument Name | Sea-Bird SBE 43 Dissolved Oxygen Sensor |
| Generic Instrument Description | The Sea-Bird SBE 43 dissolved oxygen sensor is a redesign of the Clark polarographic membrane type of dissolved oxygen sensors. more information from Sea-Bird Electronics |
| Dataset-specific Instrument Name | |
| Generic Instrument Name | Wet Labs ECO-AFL/FL Fluorometer |
| Generic Instrument Description | The Environmental Characterization Optics (ECO) series of single channel fluorometers delivers both high resolution and wide ranges across the entire line of parameters using 14 bit digital processing. The ECO series excels in biological monitoring and dye trace studies. The potted optics block results in long term stability of the instrument and the optional anti-biofouling technology delivers truly long term field measurements.
more information from Wet Labs |
McMurdo_CTDs_2012-2014
| Website | |
| Platform | McMurdo Station |
| Start Date | 2012-11-12 |
| End Date | 2015-01-09 |
| Description | Methods & Sampling CTD casts in McMurdo Sound. For calibration information and specific instrument models used please consult the CTD header files (ZIP, 131 files, 440 KB total) |
Food web dynamics in an intact ecosystem: the role of top predators in McMurdo Sound (McMurdo Predator Prey)
Extracted from the NSF award abstract:
The research project investigates the importance of top down forcing on pelagic food webs. The relatively pristine Ross Sea includes large populations of upper-level predators such as minke and killer whales, Adélie and Emperor penguins, and Antarctic toothfish. This project focuses on food web interactions of Adélie penguins, minke whales, and the fish-eating Ross Sea killer whales, all of which exert foraging pressure on their main prey, crystal krill (Euphausia cyrstallorophias) and silver fish (Pleuragramma antarcticum) in McMurdo Sound.
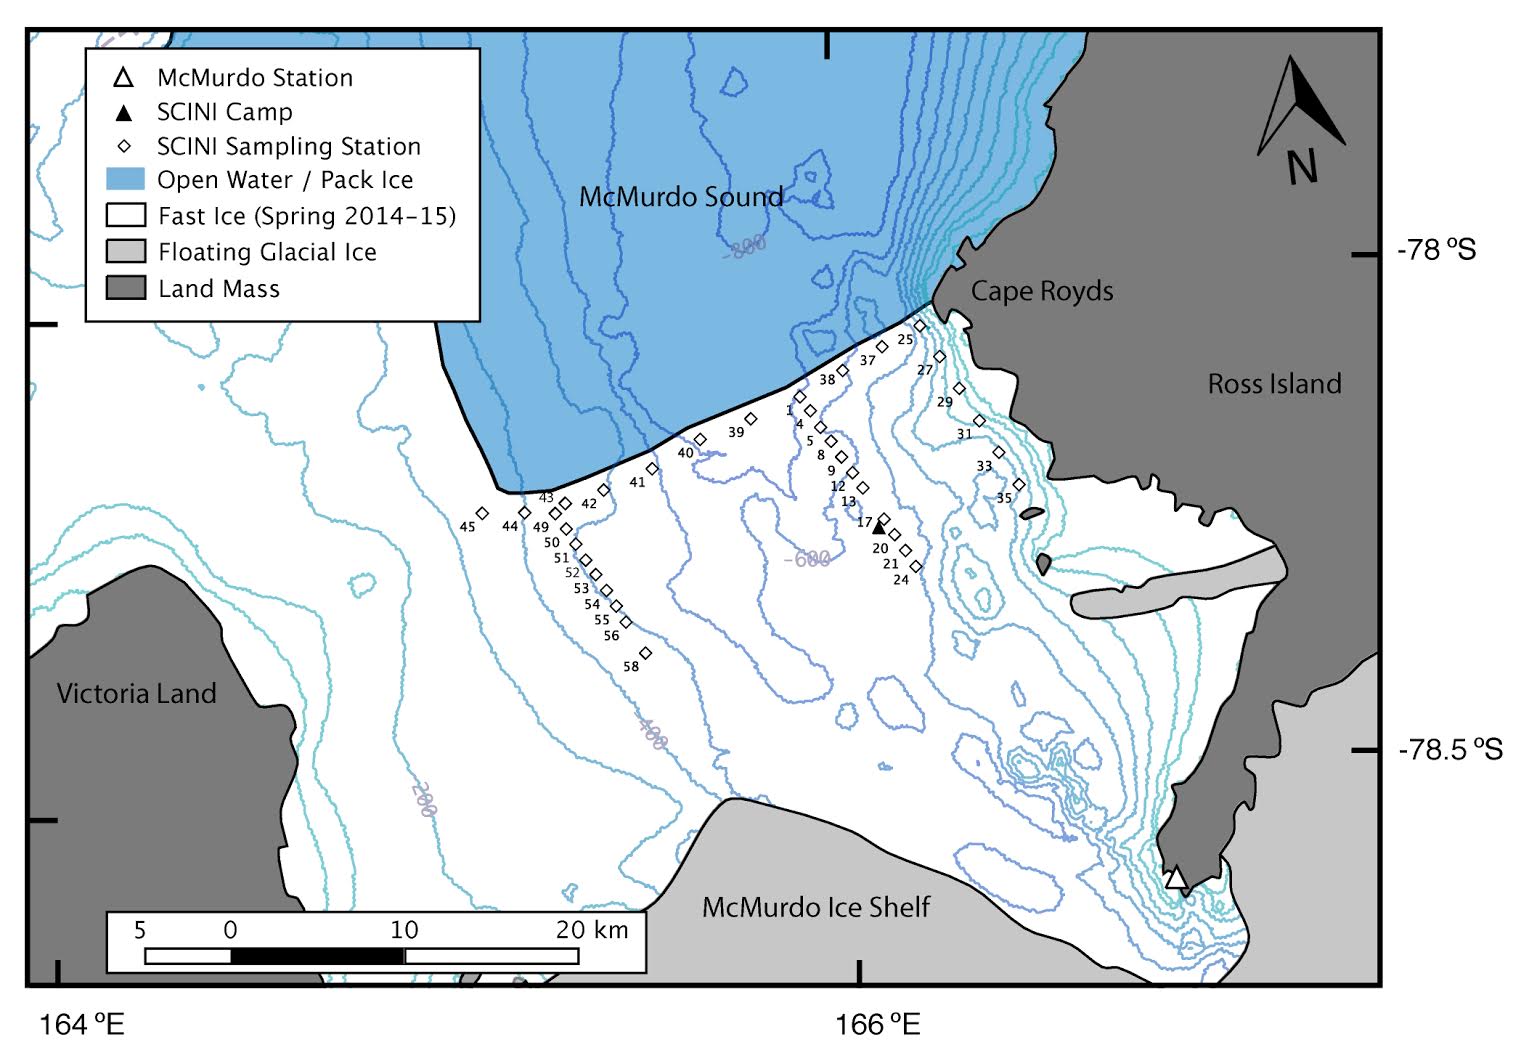
The investigators used a video- and acoustic-capable ROV, and standard biological and environmental sensors to quantify the abundance and distribution of phytoplankton, sea ice biota, prey, and relevant habitat data. The sampling area included 37 stations across an 30 x 15 km section of McMurdo Sound, stratified by distance from the ice edge as a proxy for air-breathing predator access. This study will be among the first to assess top-down forcing in the Ross Sea ecosystem and will form the basis for multidisciplinary studies in the future.
Map sampling stations
| Funding Source | Award |
|---|---|
| NSF Division of Polar Programs (NSF PLR) |
[ table of contents | back to top ]