Particle abundances and characteristics from the video plankton profiler with matching CTD data, from casts on RVIB Nathaniel B. Palmer NBP1302, Feb/Mar 2013 (TRACERS project)
Project
| Contributors | Affiliation | Role |
|---|---|---|
| Bochdansky, Alexander B. | Old Dominion University (ODU) | Principal Investigator |
| Copley, Nancy | Woods Hole Oceanographic Institution (WHOI BCO-DMO) | BCO-DMO Data Manager |
Abstract
Video particle profiler (VPP): (from Bochdansky,et al (2017) JMS)
The VPP was similar to that published in Bochdansky et al. (2010). However, instead of 45° angle lighting from both sides, side lighting with two white high-intensity LED lights was used ~7 cm in front of the lens. Some backscatter from transparent exopolymers (TEP), or from small particles embedded in that matrix, was possible using high-intensity light. The light beams were restricted using a slit width of 1 cm; however, as the light intensity dropped exponentially in the front and back of the image beam, only the brightest lit image plane was used for analysis. This method reduced bias caused by overlapping particles, removed motion blur streaks, and provided more accurate particle size estimates. At the focal plane, the field of view was 3.5 cm tall and 4.7 cm wide. The analysis program for the VPP was expanded from that in Bochdansky et al. (2010) to include more variables for particle characterization (including perimeter, volume and porosity). The VPP can record 30 images per second, with image analysis by a Linux-based image analysis program (an adapted Avidemux video editing software) at high speeds (approximately in real time after retrieval). The images were later aligned with depth from the CTD using time as the common variable and by filming a clock displaying UTC at the beginning and the end of each video sequence. In Matlab, CTD data were matched at one-second resolution with the particle data. The raw data consisted of millions of particles with associated CTD data. These raw data allow us to resample particle metrics at all scales. Particle volumes were calculated as shown in Fig. 2. Instead of assuming a specific geometric shape, the projected area of the particle on the screen (sum of white and black pixels within the perimeter of the particle) was converted into a circle that was then converted to volume. This method reduces error in volume calculations greatly because 2-dimensional information rather than 1-dimensional information is used to reconstruct volumes, thus avoiding the bias of assigning disproportionally large volumes to elongated objects. This approach is widely used in image analysis of ocean particles (e.g., Iversen et al., 2010). Total particle volume (pixel3 frame-1) was approximated by multiplying the mean volume of particles with the mean particle number.
A moving average with an unweighted 100 m window served as a low-pass filter for the particle data before they were matched with depths.
The degree of overdispersion (i.e., patchiness) in the system was assessed using two indices. One, the Lloyd index of patchiness (Lloyd, 1967), is domain-dependent (i.e., zero values affect the estimates); the other one, the index of aggregation (Bez, 2000), is domain-independent.
The Lloyd index (Lloyd, 1967) was calculated as:
(equation 1) 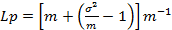 ,
,
where Lp is the Lloyd index of patchiness, m the mean particle abundance (number of particles per frame in 1 m bins), and s2 the variance of the particle abundance.
The index of aggregation (Bez, 2000) was calculated as:
(equation 2) 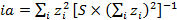 ,
,
where ia is the index of aggregation, zi the particle density, and S the sample scale (set to 1 for this analysis).
BCO-DMO Processing notes:
- added conventional header with dataset name, PI name, version date
- modified parameter names to conform with BCO-DMO naming conventions
- reduced number of digits to right of decimal due to sampling precision methods
| File |
|---|
ODV.csv (Comma Separated Values (.csv), 8.15 MB) MD5:9abe5599b4acff3ba9fa143e3a6ccdd7 Primary data file for dataset ID 683064 |
| Parameter | Description | Units |
| cast | cast number | unitless |
| depth | depth; calculated from CTD pressure | meters |
| lat | latitude; north is positive | decimal degrees |
| lon | longitude; east is positive | decimal degrees |
| julianday | Julian Day in 2013 | unitless |
| temp | temperature | degrees Celsius |
| sal | salinity | PSU |
| density | density | kg/m^3 |
| sigmatheta | sigma theta: potential density as density minus 1000 (without the effect of pressure) | kg/m^3 |
| max_sigmatheta_change | maximum change in sigma theta | kg/m^3 |
| fluor | fluorescence | relative fluorescence units |
| beamtrans | light transmission as percent | dimensionless |
| O2 | oxygen; dissolved; from CTD | micromol/kilogram |
| partnum_mean | Mean of particle numbers per video frame (averaged over 1 meter) | particles/meter |
| partnum_variance | Variance particle number per video frame (averaged over 1 meter) | particles/meter |
| length_mean | Mean of the maximum dimension of the particle per meter | pixels |
| esd_mean | Mean equivalent spherical diameter of particles per meter | pixels |
| esd_median | Median equivalent spherical diameter of particles per meter (pixels) | pixels |
| elongation | Mean elongation of particles | particles/meter |
| roundness | Mean roundness of particles | particles/meter |
| roughness | Mean roughness of particles | particles/meter |
| volume_mean | Mean volume of particles per meter | cubic pixels |
| volume_sum | Sum of volumes of particles per meter | cubic pixels |
| vmr | Variance to mean ratios of particle numbers per frame | dimensionless |
| lloyd_patchiness | Lloyd index of patchiness | unitless |
| ia | Index of aggregation | unitless |
| Dataset-specific Instrument Name | CTD |
| Generic Instrument Name | CTD - profiler |
| Dataset-specific Description | The rosette frame also held a video camera, Niskin sample bottles, conductivity, temperature and oxygen probes, and an optical backscatter sensor (Seapoint turbidity meter). The CTD with instruments was lowered at 0.5 m s−1 for the first 100 m, and then accelerated to 1 m s−1 for the remainder of each cast. |
| Generic Instrument Description | The Conductivity, Temperature, Depth (CTD) unit is an integrated instrument package designed to measure the conductivity, temperature, and pressure (depth) of the water column. The instrument is lowered via cable through the water column. It permits scientists to observe the physical properties in real-time via a conducting cable, which is typically connected to a CTD to a deck unit and computer on a ship. The CTD is often configured with additional optional sensors including fluorometers, transmissometers and/or radiometers. It is often combined with a Rosette of water sampling bottles (e.g. Niskin, GO-FLO) for collecting discrete water samples during the cast.
This term applies to profiling CTDs. For fixed CTDs, see https://www.bco-dmo.org/instrument/869934. |
| Dataset-specific Instrument Name | Black and white charge-coupled device video camera (Sentec) |
| Generic Instrument Name | Camera |
| Generic Instrument Description | All types of photographic equipment including stills, video, film and digital systems. |
NBP1302
| Website | |
| Platform | RVIB Nathaniel B. Palmer |
| Report | |
| Start Date | 2013-02-12 |
| End Date | 2013-04-05 |
| Description | Ross Sea, Antarctica (53 days)
RVIB Nathaniel B. Palmer : February-April 2013
McMurdo Station, Antarctica - Punta Arenas, Chile
Project Title: “TRacing the fate of Algal Carbon Export in the Ross Sea” (TRACERS)Chief Scientist: Dennis Hansell, UM-RSMASProject Description: The research focus of this cruise was to investigate the biogeochemistry associated after a phytoplankton bloom at the end of the Antarctic Austral Summer. I helped analyze and coordinate analyses of nutrients (silicic acid, phosphate, and nitrate) and collect samples for dissolved organic carbon (DOC).
Note R2R Link takes user to Marine Geoscience Data System (MGDS):NBP1302
Nathaniel B. Palmer Systems and Specifications |
TRacing the fate of Algal Carbon Export in the Ross Sea (TRACERS)
Sinking particles are a major element of the biological pump and they are commonly assigned to two fates: mineralization in the water column and accumulation at the seafloor. However, there is another fate of export hidden within the vertical decline of carbon, the transformation of sinking organic matter to fine suspended and/or dissolved organic fractions. This process has been suggested but has rarely been observed or quantified. As a result, it is presumed that the solubilized fraction is largely mineralized over short time scales. However, global ocean surveys of dissolved organic carbon are demonstrating a significant water column accumulation of organic matter under high productivity environments. This proposal will investigate the transformation of organic particles from sinking to solubilized phases of the export flux in the Ross Sea. The Ross Sea experiences high export particle production, low dissolved organic carbon export with overturning circulation, and the area has a predictable succession of production and export events. In addition, the basin is shallow (< 1000 m) so the products the PIs will target are relatively concentrated. To address the proposed hypothesis, the PIs will use both well-established and novel biochemical and optical measures of export production and its fate. The outcomes of this work will help researchers close the carbon budget in the Ross Sea.
| Funding Source | Award |
|---|---|
| NSF Division of Polar Programs (NSF PLR) |
[ table of contents | back to top ]