Dates of sea ice movement and sea ice distance in McMurdo Sound, Antarctica from MODIS and SSMI imagery between 1978-2015
Project
| Contributors | Affiliation | Role |
|---|---|---|
| Kim, Stacy | Moss Landing Marine Laboratories (MLML) | Chief Scientist, Principal Investigator, Contact |
| Ainley, David G. | H.T. Harvey & Associates | Co-Principal Investigator |
| Ballard, Grant | Point Blue Conservation Science | Co-Principal Investigator |
| Daly, Kendra L. | University of South Florida (USF) | Co-Principal Investigator |
| York, Amber D. | Woods Hole Oceanographic Institution (WHOI BCO-DMO) | BCO-DMO Data Manager |
Abstract
This dataset contains dates relevant to sea ice movement including dates of initial ice retreat, final ice retreat, ice minimum, general ice minimum, ice minimum for the west of McMurdo Sound, ice minimum for the east of McMurdo Sound, and refreeze start. It also includes the minimum distance to the ice edge from McMurdo Station.
Dates were derived from Moderate-resolution Imaging Spectroradiometers (MODIS) collected between 2003 and 2015 and Scanning Multichannel Microwave Radiometer and Special Sensor Microwave Imager-family passive microwave sensors (SSM/I) imagery collected between 1978 and 2015.
MODIS:
Dates of fast ice movement were determined from visible-wavelength scenes from the MODIS aboard the Aqua and Terra satellites. MODIS images are available only for the months when there is sunlight, generally October to April, and image resolution was 250 m. Figure A (see Supplemental Documents) shows the division of McMurdo Sound into six zones; fast ice areas were generated manually from clear-sky images by drawing polygons in GIS software, and pack ice was excluded from analysis. The fast ice in MODIS scenes was sometimes obscured by clouds, so for days with missing imagery we interpolated linearly between valid data. Areas of persistent multiyear ice or glaciers that were not considered in the analysis (white in the figure). Linear distance between McMurdo Station and the nearest open water on the day the ice reached the minimum extent for the season was also measured.
SSMI:
In the SSM/I record, images were available for all months of the year, and image resolution was 25 km. Figure B (see Supplemental Documents) shows the total of seven pixels in the 25 km polar stereographic projection that encompassed McMurdo Sound; for each pixel, daily or bi-daily fractional sea ice cover was extracted. SSM/I passive microwave sea ice observations do not distinguish between fast ice and pack ice. There are small amounts of land and ice shelf contamination in pixels 1, 2, 5 and 7.
The value "notobs" indicates the phenomena was not observed for two possible reasons; either the phenomena did not occur that season or imagery was not available (e.g. MODIS visual imagery was only collected during daylit months). The value 'nd' indicates no data (e.g. SSM/I imagery was too coarse to distinguish east and west side minimums).
SSM/I:
Data were processed using the bootstrap algorithm (National Snow and Ice Data Center, Comiso, 2000, Cavalieri et al. 2015) for the 1978/79-2014/15 seasons.
Comiso, J (2000, updated 2015) Bootstrap Sea Ice Concentrations from Nimbus-7 SMMR and DMSP SSM/I-SSMIS. Version 2, 1979-2015. Boulder, Colorado USA: NASA DAAC at the National Snow and Ice Data Center.
Cavalieri DJ, Parkinson CL, Gloersen P, and Zwally HJ (2015) Sea Ice Concentrations from Nimbus-7 SMMR and DMSP SSM/I-SSMIS Passive Microwave Data, Version 1.1 Southern Hemisphere, 1978-2015. Boulder, Colorado USA. NASA National Snow and Ice Data Center Distributed Active Archive Center. (doi:10.5067/8GQ8LZQVL0VL) Accessed 11 Dec 2015.
BCO-DMO Data Manager Processing Notes:
* added a conventional header with dataset name, PI name, version date
* modified parameter names to conform with BCO-DMO naming conventions
* blank values indicating no observed phenomena replaced with no data value 'nd'
* added approximate latitude and longitude of McMurdo Station
Data version 2 (2020-02-20)
* Data from data version 1 (2017-01-31) updated. Column values for “edge_dist_min, ice_min_west_year, ice_min_west_month” switched with “refreeze_begin_year, refreeze_begin_month, refreeze_begin_day” values where image_source was SSMI.
| File |
|---|
IceEdge.csv (Comma Separated Values (.csv), 5.27 KB) MD5:c915ccf065f600927ba06067976a6e06 Primary data file for dataset ID 674819 |
| File |
|---|
Map of sea ice and MODIS/SSMI survey areas in McMurdo Sound filename: MODIS.jpg (JPEG Image (.jpg), 128.41 KB) MD5:c378921f0ae7b87aec54b54c64a88d26 Figure A shows the division of McMurdo Sound into six zones; fast ice areas were generated manually from clear-sky images by drawing polygons in GIS software, and pack ice was excluded from analysis. The fast ice in MODIS scenes was sometimes obscured by clouds, so for days with missing imagery we interpolated linearly between valid data. Areas of persistent multiyear ice or glaciers that were not considered in the analysis (white in the figure).
Figure B shows the total of seven pixels in the 25 km polar stereographic projection that encompassed McMurdo Sound; for each pixel, daily or bi-daily fractional sea ice cover was extracted. SSM/I passive microwave sea ice observations do not distinguish between fast ice and pack ice. There are small amounts of land and ice shelf contamination in pixels 1, 2, 5 and 7. |
| Parameter | Description | Units |
| lat_approx | Approximate latitude of sampling near McMurdo Station; Antarctica; south is negative | decimal degrees |
| lon_approx | Approximate longitude of sampling near McMurdo Station; Antarctica; west is negative | decimal degrees |
| image_source | Image source (MODIS or SSM/I) | unitless |
| austral_year | Austral Year (start year/end year) in format yyyy/yy | unitless |
| retreat_initial_year | Year of initial ice retreat | unitless |
| retreat_initial_month | Month of initial ice retreat | unitless |
| retreat_initial_day | Day of initial ice retreat | unitless |
| retreat_final_year | Year of final ice retreat | unitless |
| retreat_final_month | Month of final ice retreat | unitless |
| retreat_final_day | Day of final ice retreat | unitless |
| ice_min_year | Year ice reached minimum in McMurdo Sound | unitless |
| ice_min_month | Month ice reached minimum in McMurdo Sound | unitless |
| ice_min_day | Day ice reached minimum in McMurdo Sound | unitless |
| edge_dist_min | Linear distance between McMurdo Station and the nearest open water on the day the ice reached the minimum extent for the season. | kilometers |
| ice_min_west_year | Year ice reached minimum on west side of McMurdo Sound | unitless |
| ice_min_west_month | Month ice reached minimum on west side of McMurdo Sound | unitless |
| ice_min_west_day | Day ice reached minimum on west side of McMurdo Sound | unitless |
| ice_min_east_year | Year ice reached minimum on east side of McMurdo Sound | unitless |
| ice_min_east_month | Month ice reached minimum on east side of McMurdo Sound | unitless |
| ice_min_east_day | Day ice reached minimum on east side of McMurdo Sound | unitless |
| refreeze_begin_year | Year ice began to refreeze | unitless |
| refreeze_begin_month | Month ice began to refreeze | unitless |
| refreeze_begin_day | Day ice began to refreeze | unitless |
| Dataset-specific Instrument Name | Scanning Multichannel Microwave Radiometer |
| Generic Instrument Name | Radiometer |
| Dataset-specific Description | Scanning Multichannel Microwave Radiometer |
| Generic Instrument Description | Radiometer is a generic term for a range of instruments used to measure electromagnetic radiation (radiance and irradiance) in the atmosphere or the water column. For example, this instrument category includes free-fall spectral radiometer (SPMR/SMSR System, Satlantic, Inc), profiling or deck cosine PAR units (PUV-500 and 510, Biospherical Instruments, Inc). This is a generic term used when specific type, make and model were not specified. |
| Dataset-specific Instrument Name | MODIS |
| Generic Instrument Name | Radiometer |
| Dataset-specific Description | Moderate-resolution Imaging Spectroradiometers (MODIS) |
| Generic Instrument Description | Radiometer is a generic term for a range of instruments used to measure electromagnetic radiation (radiance and irradiance) in the atmosphere or the water column. For example, this instrument category includes free-fall spectral radiometer (SPMR/SMSR System, Satlantic, Inc), profiling or deck cosine PAR units (PUV-500 and 510, Biospherical Instruments, Inc). This is a generic term used when specific type, make and model were not specified. |
| Dataset-specific Instrument Name | SSM/I |
| Generic Instrument Name | Special Sensor Microwave Imager |
| Dataset-specific Description | Special Sensor Microwave Imager-family passive microwave sensors (SSM/I) |
| Generic Instrument Description | The Special Sensor Microwave Imager (SSM/I) is a passive microwave radiometer that measures atmospheric, oceanic and terrestrial microwave brightness temperatures at 19.35, 22.2, 37.0, and 85.5 GHz, from which ocean surface wind speed, atmospheric water vapour, cloud liquid water and rain rate can be derived. The SSM/I consists of an offset parabolic reflector of dimensions 24 x 26 inches, fed by a corrugated, broad-band, seven-port horn antenna. The reflector and feed are mounted on a drum that contains the radiometers, digital data subsystem, mechanical scanning subsystem, and power subsystem. The reflector-feed-drum assembly is rotated about the axis of the drum by a coaxially mounted bearing and power transfer assembly (BAPTA). All data, commands, timing and telemetry signals, and power pass through the BAPTA on slip ring connectors to the rotating assembly. The absolute brightness temperature of the scene incident upon the antenna is received and spatially filtered by the antenna to produce an effective input signal or antenna temperature at the input of the feed horn antenna. The SSM/I has seven channels, four frequencies, and is orthogonally polarised. It rotates continuously about an axis parallel to the local spacecraft at 31.6 rpm and measures the upwelling scene brightness temperature over an angular range of 102.4 degrees at nadir. The active scene measurements lie +51.2 to -51.2 degrees about the forward (F10, F11) or aft (F8) direction. This results in a swath width of approximately 1400 kilometres. During each 1.9 second scan, 128 discrete uniformly spaced radiometric samples are taken at the two 85 GHz channels and, on alternate scans, 64 discrete samples are taken at the remaining lower frequency channels. The antenna beam intersects the Earth's surface at an incidence angle of 53.1 degrees. Flown on F08, F10, F11, F13, F14, F15, F16, F17, F18 F19. https://nsidc.org/data/docs/daac/ssmi_instrument.gd.html |
TERRA_McMurdo_observations
| Website | |
| Platform | TERRA |
| Start Date | 2003-01-09 |
| End Date | 2015-02-10 |
AQUA_McMurdo_observations
| Website | |
| Platform | AQUA |
| Start Date | 2003-02-10 |
| End Date | 2015-02-10 |
Food web dynamics in an intact ecosystem: the role of top predators in McMurdo Sound (McMurdo Predator Prey)
Extracted from the NSF award abstract:
The research project investigates the importance of top down forcing on pelagic food webs. The relatively pristine Ross Sea includes large populations of upper-level predators such as minke and killer whales, Adélie and Emperor penguins, and Antarctic toothfish. This project focuses on food web interactions of Adélie penguins, minke whales, and the fish-eating Ross Sea killer whales, all of which exert foraging pressure on their main prey, crystal krill (Euphausia cyrstallorophias) and silver fish (Pleuragramma antarcticum) in McMurdo Sound.
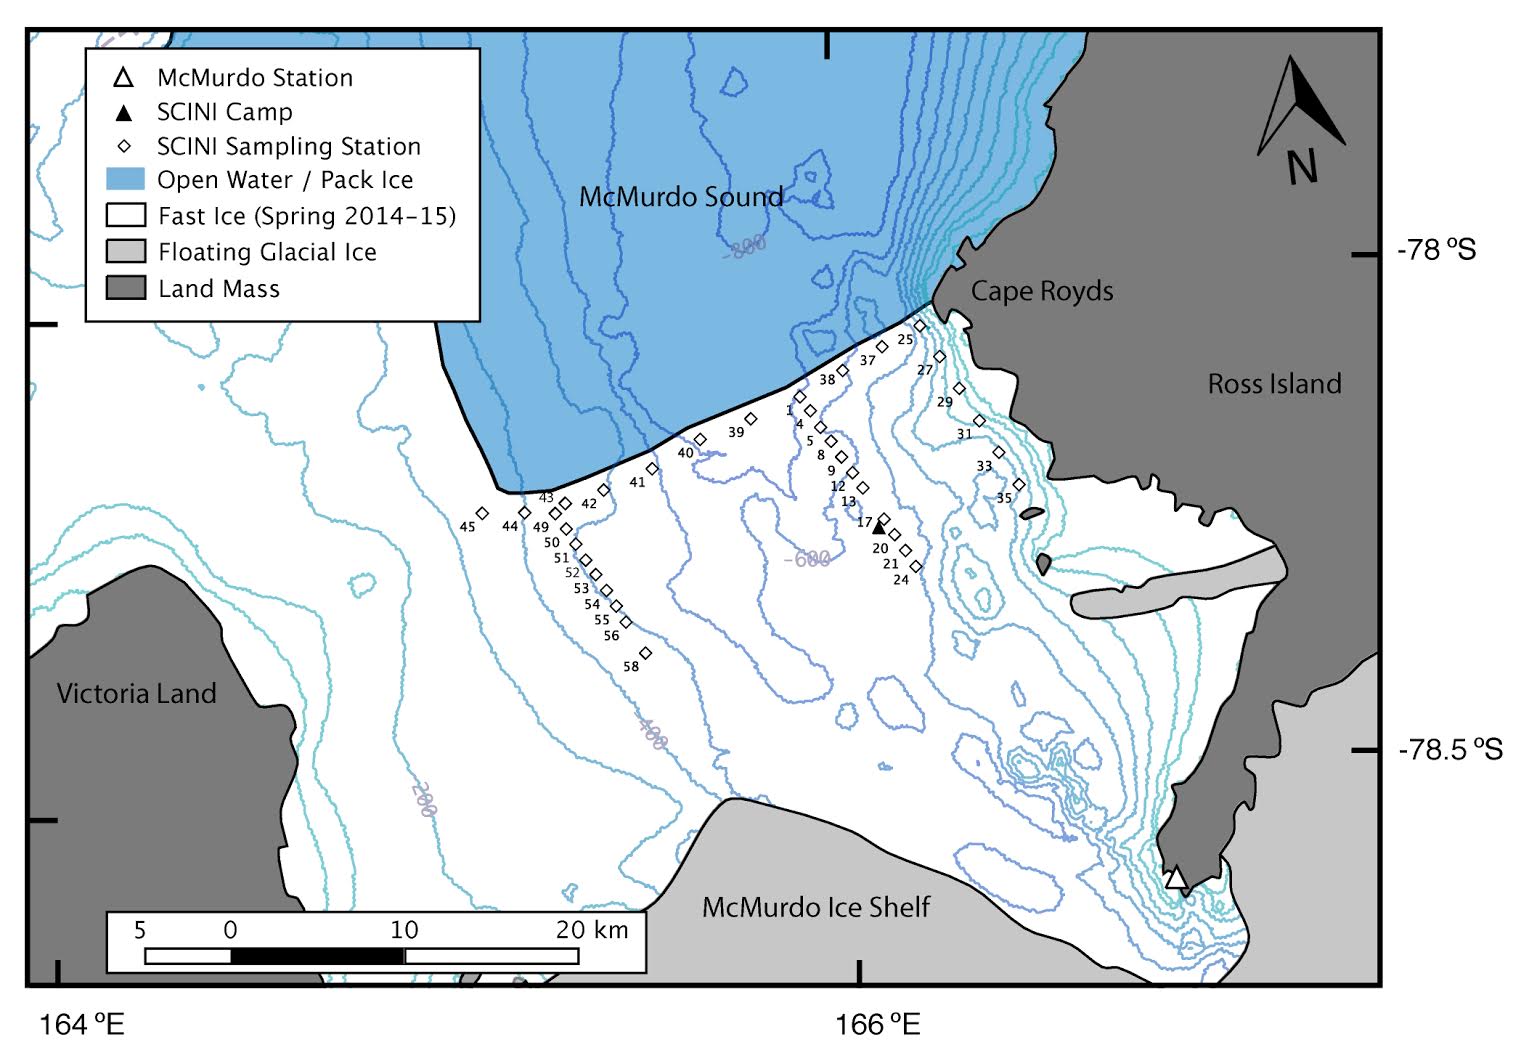
The investigators used a video- and acoustic-capable ROV, and standard biological and environmental sensors to quantify the abundance and distribution of phytoplankton, sea ice biota, prey, and relevant habitat data. The sampling area included 37 stations across an 30 x 15 km section of McMurdo Sound, stratified by distance from the ice edge as a proxy for air-breathing predator access. This study will be among the first to assess top-down forcing in the Ross Sea ecosystem and will form the basis for multidisciplinary studies in the future.
Map sampling stations
| Funding Source | Award |
|---|---|
| NSF Division of Polar Programs (NSF PLR) | |
| NSF Division of Polar Programs (NSF PLR) | |
| NSF Division of Polar Programs (NSF PLR) |
[ table of contents | back to top ]