ScanFish Optical Plankton Counter (OPC) data from R/V Pelican cruises PE03-NGOMEX, PE04-NGOMEX, PE06-NGOMEX, PE07-NGOMEX, PE09-05, and PE11-06 in the Northern Gulf of Mexico between 2003 and 2010
Project
Program
| Contributors | Affiliation | Role |
|---|---|---|
| Roman, Michael R. | University of Maryland Center for Environmental Science (UMCES/HPL) | Principal Investigator |
| Boicourt, William C. | University of Maryland Center for Environmental Science (UMCES/HPL) | Co-Principal Investigator |
| Huebert, Klaus B. | University of Maryland Center for Environmental Science (UMCES/HPL) | Co-Principal Investigator, Contact |
| Pierson, James J. | University of Maryland Center for Environmental Science (UMCES/HPL) | Co-Principal Investigator |
| York, Amber D. | Woods Hole Oceanographic Institution (WHOI BCO-DMO) | BCO-DMO Data Manager |
Abstract
Subsets of these data were published in the papers listed in the "Related Resources" section.
Related dataset:
* Pump mesozooplankton samples: https://www.bco-dmo.org/dataset/746107
Methodology:
A CTD and optical plankton counter mounted to a ScanFish platform were towed and undulated behind the vessel.
Sampling and analytical procedures:
The ScanFish was towed at a mean speed of 2.7 m/s with mean vertical descent and ascent rates of 0.3 m/s.
Notes for specific data columns:
Dissolved oxygen concentration (column "oxy"): values corrected vs. CTD rosette casts and Winkler titrations when available.
Sample volume (column "vol"): estimated from OPC mouth opening and changes in lat, lon, and depth
Data column definitions for particle counts and biovolume density include the term "ESD" which stands for "equivalent spherical diameter."
Biovolume densities (data column names beginning with "v_") were calculated using the following formula:
v = sum(4/3*pi*(0.5*ESD*1e-3)^3)/vol
The light attenuance (column "light") has relative units and the OPC unit used starting Sep. 5, 2010 22:30:00 UTC was calibrated differently.
Data processing:
Previously processed CTD files (https://www.bco-dmo.org/dataset/3547) and MIDAS files (https://www.bco-dmo.org/dataset/3548) were synchronized and merged with simultaneously collected OPC data. Quality controlled and interpolated MIDAS data were used as the common reference system for longitude, latitude, and time. Since the OPC clock gradually and unpredictably drifted relative to MIDAS time, synchronization was accomplished by measuring and correcting for temporal lag via cross-correlations of moving windows of OPC and CTD pressure sensor time series (with the remaining error generally <0.5 s). Data were then aggregated into 1 s time bins. The standard reference for depth was OPC pressure, adjusted to compensate for non-zero readings on deck of the research vessel over the course of each cruise. The 15 arc second resolution NOAA NCEI coastal relief model for the northern Gulf of Mexico was used as a reference for bathymetry. Data were divided into distinct vertical profiles, and only those profiles were included in the final dataset that either sampled the water column from <3 m below the surface to <3 above the bottom or sampled >30 m of vertical distance, or both. Estimated OPC particle sizes from 256 to 2048 µm equivalent spherical diameter were aggregated into 12 logarithmically spaced size bins (other particle sizes were excluded). For CTD files with both raw and corrected oxygen data, the corrected version was used. All data processing was performed using the R language and environment for statistical computing.
BCO-DMO Data Manager Processing Notes:
* added a conventional header with dataset name, PI name, version date.
* modified parameter names to conform with BCO-DMO naming conventions. Periods in column names changed to underscores.
* added ISO Timestamp column
* rounded decimal places of columns. Number of decimal places provided by data contributor.
* Missing data values are shown as the BCO-DMO missing data identifier "nd" meaning "no data."
| File |
|---|
scanfish_opc.csv (Comma Separated Values (.csv), 364.57 MB) MD5:64c822dc80ae37f3af008b6670818c60 Primary data file for dataset ID 746081 |
| Parameter | Description | Units |
| profile | ScanFish profile ID which includes profile start time in UTC | unitless |
| lon | MIDAS longitude | decimal degrees |
| lat | MIDAS latitude | decimal degrees |
| ISO_DateTime_UTC | Timestamp (UTC) in standard ISO 8601:2004(E) format YYYY-mm-ddTHH:MM:SSZ | unitless |
| depth | OPC depth | dbar |
| temp | CTD temperature | degrees Celsius (C) |
| sal | CTD salinity | unitless |
| oxy | CTD dissolved oxygen concentration | milligrams per liter (mg/l) |
| chl | CTD chlorophyll a fluorescence | milligrams per cubic meter (mg/m^3) |
| CDOM | CTD colored dissolved organic matter fluorescence | milligrams per cubic meter (mg/m^3) |
| light | OPC light attenuance. The units are relative. The OPC unit used starting Sep. 5, 2010 22:30:00 UTC was calibrated differently. | relative |
| n_0256_0279 | OPC particle count (0256 to 0279 um ESD) | unitless |
| n_0279_0304 | OPC particle count (0279 to 0304 um ESD) | unitless |
| n_0304_0332 | OPC particle count (0304 to 0332 um ESD) | unitless |
| n_0332_0362 | OPC particle count (0332 to 0362 um ESD) | unitless |
| n_0362_0395 | OPC particle count (0362 to 0395 um ESD) | unitless |
| n_0395_0431 | OPC particle count (0395 to 0431 um ESD) | unitless |
| n_0431_0470 | OPC particle count (0431 to 0470 um ESD) | unitless |
| n_0470_0512 | OPC particle count (0470 to 0512 um ESD) | unitless |
| n_0512_0558 | OPC particle count (0512 to 0558 um ESD) | unitless |
| n_0558_0609 | OPC particle count (0558 to 0609 um ESD) | unitless |
| n_0609_0664 | OPC particle count (0609 to 0664 um ESD) | unitless |
| n_0664_0724 | OPC particle count (0664 to 0724 um ESD) | unitless |
| n_0724_0790 | OPC particle count (0724 to 0790 um ESD) | unitless |
| n_0790_0861 | OPC particle count (0790 to 0861 um ESD) | unitless |
| n_0861_0939 | OPC particle count (0861 to 0939 um ESD) | unitless |
| n_0939_1024 | OPC particle count (0939 to 1024 um ESD) | unitless |
| n_1024_1117 | OPC particle count (1024 to 1117 um ESD) | unitless |
| n_1117_1218 | OPC particle count (1117 to 1218 um ESD) | unitless |
| n_1218_1328 | OPC particle count (1218 to 1328 um ESD) | unitless |
| n_1328_1448 | OPC particle count (1328 to 1448 um ESD) | unitless |
| n_1448_1579 | OPC particle count (1448 to 1579 um ESD) | unitless |
| n_1579_1722 | OPC particle count (1579 to 1722 um ESD) | unitless |
| n_1722_1878 | OPC particle count (1722 to 1878 um ESD) | unitless |
| n_1878_2048 | OPC particle count (1878 to 2048 um ESD) | unitless |
| vol | OPC sample volume | cubic meters (m^3) |
| v_0256_0279 | OPC biovolume density (0256 to 0279 um ESD) | cubic millimeters per cubic meter (mm^3/m^3) |
| v_0279_0304 | OPC biovolume density (0279 to 0304 um ESD) | cubic millimeters per cubic meter (mm^3/m^3) |
| v_0304_0332 | OPC biovolume density (0304 to 0332 um ESD) | cubic millimeters per cubic meter (mm^3/m^3) |
| v_0332_0362 | OPC biovolume density (0332 to 0362 um ESD) | cubic millimeters per cubic meter (mm^3/m^3) |
| v_0362_0395 | OPC biovolume density (0362 to 0395 um ESD) | cubic millimeters per cubic meter (mm^3/m^3) |
| v_0395_0431 | OPC biovolume density (0395 to 0431 um ESD) | cubic millimeters per cubic meter (mm^3/m^3) |
| v_0431_0470 | OPC biovolume density (0431 to 0470 um ESD) | cubic millimeters per cubic meter (mm^3/m^3) |
| v_0470_0512 | OPC biovolume density (0470 to 0512 um ESD) | cubic millimeters per cubic meter (mm^3/m^3) |
| v_0512_0558 | OPC biovolume density (0512 to 0558 um ESD) | cubic millimeters per cubic meter (mm^3/m^3) |
| v_0558_0609 | OPC biovolume density (0558 to 0609 um ESD) | cubic millimeters per cubic meter (mm^3/m^3) |
| v_0609_0664 | OPC biovolume density (0609 to 0664 um ESD) | cubic millimeters per cubic meter (mm^3/m^3) |
| v_0664_0724 | OPC biovolume density (0664 to 0724 um ESD) | cubic millimeters per cubic meter (mm^3/m^3) |
| v_0724_0790 | OPC biovolume density (0724 to 0790 um ESD) | cubic millimeters per cubic meter (mm^3/m^3) |
| v_0790_0861 | OPC biovolume density (0790 to 0861 um ESD) | cubic millimeters per cubic meter (mm^3/m^3) |
| v_0861_0939 | OPC biovolume density (0861 to 0939 um ESD) | cubic millimeters per cubic meter (mm^3/m^3) |
| v_0939_1024 | OPC biovolume density (0939 to 1024 um ESD) | cubic millimeters per cubic meter (mm^3/m^3) |
| v_1024_1117 | OPC biovolume density (1024 to 1117 um ESD) | cubic millimeters per cubic meter (mm^3/m^3) |
| v_1117_1218 | OPC biovolume density (1117 to 1218 um ESD) | cubic millimeters per cubic meter (mm^3/m^3) |
| v_1218_1328 | OPC biovolume density (1218 to 1328 um ESD) | cubic millimeters per cubic meter (mm^3/m^3) |
| v_1328_1448 | OPC biovolume density (1328 to 1448 um ESD) | cubic millimeters per cubic meter (mm^3/m^3) |
| v_1448_1579 | OPC biovolume density (1448 to 1579 um ESD) | cubic millimeters per cubic meter (mm^3/m^3) |
| v_1579_1722 | OPC biovolume density (1579 to 1722 um ESD) | cubic millimeters per cubic meter (mm^3/m^3) |
| v_1722_1878 | OPC biovolume density (1722 to 1878 um ESD) | cubic millimeters per cubic meter (mm^3/m^3) |
| v_1878_2048 | OPC biovolume density (1878 to 2048 um ESD) | cubic millimeters per cubic meter (mm^3/m^3) |
| bathy | NOAA NCEI coastal relief model bottom depth | meters (m) |
| Dataset-specific Instrument Name | Sea-Bird 9 CTD |
| Generic Instrument Name | CTD - profiler |
| Generic Instrument Description | The Conductivity, Temperature, Depth (CTD) unit is an integrated instrument package designed to measure the conductivity, temperature, and pressure (depth) of the water column. The instrument is lowered via cable through the water column. It permits scientists to observe the physical properties in real-time via a conducting cable, which is typically connected to a CTD to a deck unit and computer on a ship. The CTD is often configured with additional optional sensors including fluorometers, transmissometers and/or radiometers. It is often combined with a Rosette of water sampling bottles (e.g. Niskin, GO-FLO) for collecting discrete water samples during the cast.
This term applies to profiling CTDs. For fixed CTDs, see https://www.bco-dmo.org/instrument/869934. |
| Dataset-specific Instrument Name | Focal Technologies Optical Plankton Counter OPC-1T |
| Generic Instrument Name | Optical Plankton Counter |
| Generic Instrument Description | An OPC provides quantitative measurements of abundance and sizes of mesozooplankton ranging between approximately 0.25 and 14 mm in Equivalent Spherical Diameter (ESD), and has the capability to integrate measurements from other sensors such as a CTD, fluorometer and Global Positioning System (GPS). It can be deployed on a variety of instruments such as SeaSoar, Aries, Scanfish, MOCNESS, a bongo net or simple towing frame. The data from an OPC are typically transmitted to a data acquisition computer through two conducting wires in a towing cable at real time, but it can also be modified to have an internal memory. Large amounts of data are produced. The procedures employed by OPC users vary from; i) estimating integrated biomass by integrating the OPC size distributions, ii) comparing size distributions between OPC and net samples, and iii) simply isolating a size region in the OPC size distribution which correspond solely to specific taxa, eg. Calanus spp..
from: Zhou, M., Tande, K., 2002. Optical Plankton Counter Workshop. GLOBEC Report 17, University of Tromso, Tromso |
| Dataset-specific Instrument Name | GMI ScanFish |
| Generic Instrument Name | towed undulating vehicle |
| Generic Instrument Description | A towed undulating vehicle is a generic class of instruments. See the data set specific information for a detailed description. These are often prototype instrument packages designed to make very specific measurements. |
PE03-NGOMEX
| Website | |
| Platform | R/V Pelican |
| Start Date | 2003-06-30 |
| End Date | 2003-08-05 |
| Description | 2003 Sampling cruise to the Northern Gulf of Mexico
Note: Deployment Id assigned by BCO-DMO staff (not official) |
PE04-NGOMEX
| Website | |
| Platform | R/V Pelican |
| Start Date | 2004-07-28 |
| End Date | 2004-08-02 |
| Description | 2004 Sampling cruise to the Northern Gulf of Mexico
Note: Deployment Id assigned by BCO-DMO staff (not official) |
PE06-NGOMEX
| Website | |
| Platform | R/V Pelican |
| Start Date | 2006-08-04 |
| End Date | 2006-08-13 |
| Description | 2006 Sampling cruise to the Northern Gulf of Mexico
Note: Deployment Id and Chief Scientist assigned by BCO-DMO staff (not official) |
PE07-NGOMEX
| Website | |
| Platform | R/V Pelican |
| Start Date | 2007-07-21 |
| End Date | 2007-08-07 |
| Description | 2007 Sampling cruise to the Northern Gulf of Mexico
Note: Deployment Id and Chief Scientist assigned by BCO-DMO staff (not official) |
PE09-05
| Website | |
| Platform | R/V Pelican |
| Start Date | 2008-08-01 |
| End Date | 2008-08-12 |
| Description | 2008 Sampling cruise to the Northern Gulf of Mexico
Note: Cruise ID confirmed with R2R catalog
Original cruise data are available from the NSF R2R data catalog |
PE11-06
| Website | |
| Platform | R/V Pelican |
| Start Date | 2010-09-01 |
| End Date | 2010-09-07 |
| Description | 2010 Sampling cruise to the Northern Gulf of Mexico
Note: Cruise ID confirmed with R2R catalog
Original cruise data are available from the NSF R2R data catalog |
NGOMEX - Living Marine Resources of the Northern Gulf of Mexico (GoMX - NGOMEX)
NGOMEX - Living Organisms of the Northern Gulf of Mexico
A synthesis of data collected in the Northern Gulf of Mexico from 2003-2004, 2006-2008 and 2010
Data include:
- CTD Profiles
- Rosette Samples
- MIDAS underway metereological
- Towed SCANFISH
- Net Trawls
- Zooplankton counts
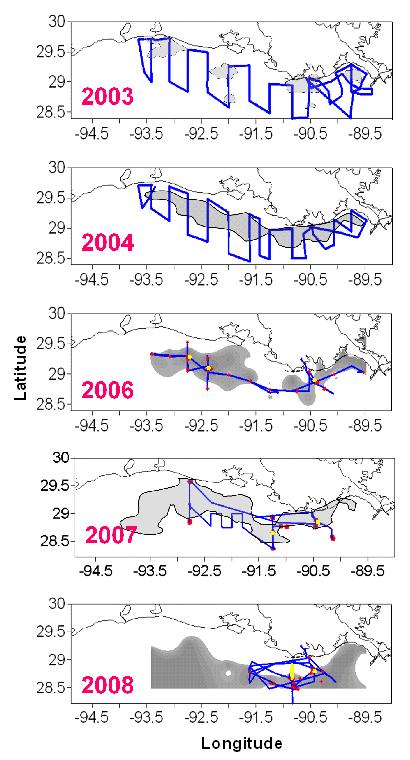
High-resolution mapping of the major ecosystem components of the NGOMEX by year
References:
Kimmel, D. G., W. C. Boicourt, J. J. Pierson, M. R. Roman, X. Zhang. 2010. The vertical distribution and diel variability of mesozooplankton biomass, abundance and size in response to hypoxia in the northern Gulf of Mexico USA. Journal of Plankton Research 32(8): 1185-1202. doi:10.1093/plankt/fbp136
Pierson, J. J., M. R. Roman, D. G. Kimmel, W. C. Boicourt, & X. Zhang. 2009. Quantifying changes in the vertical distribution of mesozooplankton in response to hypoxic bottom waters. Journal of Experimental Marine Biology and Ecology 381: S74-S79. doi.org/10.1016/j.jembe.2009.07.013
Kimmel, D. G., W. C. Boicourt, J. J. Pierson, M. R. Roman, & X. Zhang. 2009. A comparison of the mesozooplankton response to hypoxia in Chesapeake Bay and the northern Gulf of Mexico using the biomass size spectrum. Journal of Experimental Marine Biology and Ecology 381: S65-S73. doi.org/10.1016/j.jembe.2009.07.012
Zhang, H., S. A. Ludsin, D. M. Mason, A. T. Adamack, S. B. Brandt, X. Zhang, D. G. Kimmel, M. R. Roman, & W. C. Boicourt. 2009. Hypoxia-driven changes in the behavior and spatial distribution of pelagic fish and mesozooplankton in the northern Gulf of Mexico. Journal of Experimental Marine Biology and Ecology. 381: S80-91. http://dx.doi.org/10.1016/j.jembe.2009.07.014
Gulf of Mexico - Deepwater Horizon Oil Spill (GoMX - DHOS)
GOM - Broader Impacts
The need to understand the impact of this largest oil spill to date on ecosystems and biochemical cycling is self evident. The consequences of the disaster and accompanying clean up measures (e.g. the distribution of dispersants) need to be evaluated to guide further mediating measures and to develop and improve responses to similar disasters in the future. Would it be advantageous if such oil aggregates sink, or should it rather remain suspended? Possibly measures can be developed to enhance sinking or suspension (e.g. addition of ballast minerals) once we understand their current formation and fate. Understanding the particle dynamics following the input of large amounts of oil and dispersants into the water is a prerequisite to develop response strategies for now and in the future.
[ table of contents | back to top ]