These methods are required for sample collection, analysis, and establishment of the microcosms.
Sample collection: Seawater samples were collected from the shores of Apalachicola Bay at Wolley Park (30.0285° N, 84.3878° W). Approximately 100 liters of water were collected for laboratory analysis.
Physico-chemical properties: Physico-chemical properties of the water, including temperature, pH, salinity, dissolved solutes, and dissolved oxygen, were measured in situ using a HANNA HI 9829 Multiparameter.
Growth of bacterial species:
Bacterial consortia as potential prey
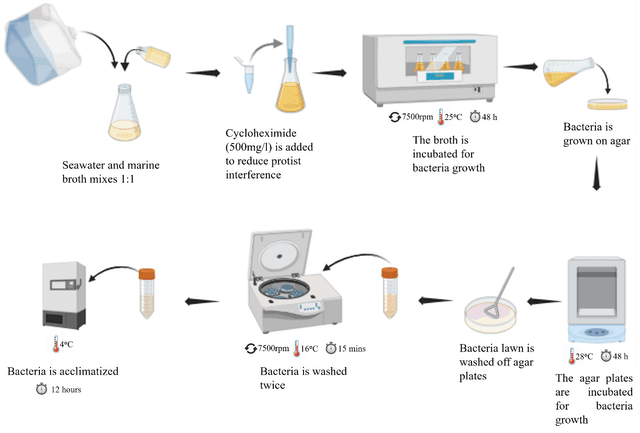
A consortium of bacteria was grown from natural seawater. Natural seawater (NSW) (100 mL) was mixed with an equal volume of freshly prepared marine broth 2216 (MB) (100 mL) to produce a 200 mL solution containing 50% MB in NSW. To control protist predation, cycloheximide was added at a final concentration of 500 mg/L, following the method described by McCambridge & Mcmeekin (1980). The resulting mixture was incubated at 25°C for 48 hours, with samples collected every 12 hours to monitor bacterial growth via optical density measurements at wavelength (λ) of 600 nm (OD600).
After 48 hours of incubation, 200 μL of the bacterial suspension was spread onto 50% marine agar 2216 (MA) plates (20 polystyrene petri dishes, 150 mm diameter, 143.0 cm² growth area) to establish bacterial lawns. Additionally, the bacterial culture was serially diluted to 10⁻⁴, and 200 μL of the diluted suspension was spread onto 20 additional 50% MA plates to establish single growing colonies.
All plates were incubated at 28°C for 48 hours for bacterial growth. After incubation, bacteria from all 40 plates were harvested by washing off the MA plates using an L-loop and sterile seawater, pooled together, and centrifuged at 7,000 rpm for 30 minutes. The bacterial pellet was washed twice by re-suspending and homogenizing in sterile seawater, and then re-centrifuging to remove residual media.
Finally, the bacteria were re-suspended in sterile seawater and incubated for 12 hours at 4°C to allow for acclimatization before use in subsequent experiments.
Pure culture prey:
Single colonies of Vibrio parahaemolyticus, and Roseobacter isolated from seawater were used as potential prey. Pure cultures were maintained on saltwater yeast extract (SWYE) agar. Colonies were cultured on SWYE agar for 48 hours, then harvested and washed twice with sterile seawater. The cells were also acclimated in sterile seawater for 12 hours at 4°C before use.
Preparation of microcosms:
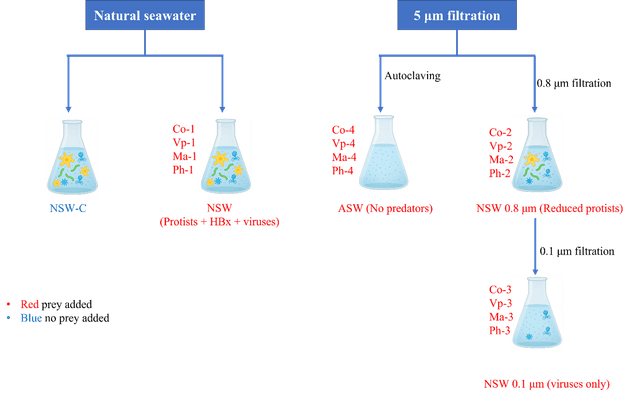
Four seawater treatment groups were established, with each treatment prepared in a final volume of 250 mL. Seawater was first allowed to stand undisturbed for 30 minutes to settle particulates. Subsequently, 250 mL of seawater was transferred into sterile flasks for each treatment.
• Treatment 1: Unfiltered natural seawater containing all native wild microbial predators (protists, predatory bacteria, and viruses).
• Treatment 2: Seawater filtered through 10 µm filter paper (Ahlstrom-Munksjo, Grade 54, 18.5 cm), then through 0.8 µm filter (28mm Corning syringe, Corning, NY) to selectively reduce protist presence while retaining smaller predators such as predatory bacteria and viruses.
• Treatment 3: The 0.8 µm filtered seawater was sequentially filtered through 0.45 µm, 0.2 µm, and 0.1 µm filters using Genesee Scientific Gen Clone vacuum-driver filter system to remove all cells, retaining only viral particles.
• Treatment 4: Seawater subjected to autoclaving at 121°C for 30 minutes to eliminate all biological activity, including viruses.
In each treatment flask, prey bacteria, either from bacterial consortia or single colony isolates, will be inoculated to achieve an initial optical density (OD₆₀₀) of 0.6 or an OD range (0.1-1 OD) as required. For the prey concentration experiment, the prey concentration was fixed at 1.0 to 0.1 OD. An additional control group consisting of untreated natural seawater without prey inoculation was also included to assess background microbial activity.
Incubation of microcosms
The microcosms established above were incubated at 25°C while shaking at 80 rpm for 120 hours. Samples were retrieved from each microcosm immediately before and after adding the prey/nutrient (at the beginning of the experiment), and at six-hour intervals for 120 hours to monitor the flux in micro-predators and in the Vibrio and total bacteria populations.
Collection of samples from microcosms
Samples were collected and processed into different tubes for different microbial analyses, RT-qPCR, fluorescent microscopy, and flow cytometry. The samples were collected into 2 ml sterile microtubes (MSP brand Cat. No. 62-1008-13). For RT-qPCR, 1 ml of sample was collected into a sterile tube and immediately stored at -20ºC. While for flow cytometry, samples were fixed by mixing 1ml of sample with 100μL of 20 % formalin, then the sample was stored at 4 ºC. For fluorescent microscopy, 1 ml of sample was fixed with 40μL of 1% glutaraldehyde and stored at -20 ºC.
DNA extraction and quantification
The DNA extraction was carried using Qiagen DNeasy®️, and PowerLyser®️ PowersSoil®️ DNA isolation kit. All centrifugation was done using Eppendorf centrifuge (5417C) at 10,000 rcf, for one minute. The DNA concentration and quality were determined using a Nanodrop Spectrophotometer ND-100, and the DNA was stored at -20ºC for RT-qPCR.
General principles of RT-qPCR
A) Instrumentation
Quantitative real-time PCR was performed using a CFX96 Real-Time PCR Detection System (Bio-Rad) coupled with a C1000 Touch Thermal Cycler. To remain within the validated detection range of the assay, all sample DNA concentrations were not below the lowest standard concentration included in the calibration curve.
B) Target genes
All RT-qPCR assays targeted the 16S rRNA gene within genomic DNA, using primers specific for the target bacterial species. The PCR template consisted of genomic DNA extracted from microcosm samples conducted in duplicate (or triplicate, where specified).
Method of quantification of gene product using RT-qPCR
Quantitative PCR (qPCR) assays were performed using the Bio-Rad CFX Real-Time PCR System to quantify target genes from the DNA extracts. Two amplification protocols were implemented. The first protocol was used for the quantification of all the bacterial targets (except Halobacteriovorax). It employed a two-step cycling approach consisting of an initial denaturation at 98°C for 2 min, followed by 39 amplification cycles of denaturation at 98°C for 10 s and combined annealing/extension at 60°C for 45 s. The second protocol, used for HBx quantification, followed a conventional three-step amplification workflow consisting of an initial denaturation at 94°C for 2 min, followed by 44 cycles of denaturation at 94°C for 30 s, annealing at 55°C for 30 s, and extension at 72°C for 40 s. For both assays, amplification specificity was evaluated using melt curve analysis initiated at 95°C and gradually increased from 65°C to 95°C in 0.5°C increments. Fluorescence data were acquired during amplification cycles, and melt curve profiles were used to confirm the absence of nonspecific amplification and primer-dimer formation.
Standard curve
A genomic DNA (gDNA)-based standard curve was successfully generated using five 10-fold serial dilutions of a quantified DNA stock solution. The initial genomic DNA concentration (C₀, ng/µL), determined spectrophotometrically, was used to prepare standards corresponding to 10⁰, 10⁻¹, 10⁻², 10⁻³, 10⁻⁴, and 10⁻5 dilutions. Each dilution was prepared by transferring 3 µL of the preceding solution into 27 µL of nuclease-free water, producing an exact 10-fold decrease in concentration at each step. All standards were amplified in triplicate using RT-qPCR and the Ct value per DNA concentration was determined.
To convert DNA mass concentration to genome copy number, the following relationship was used:
Copy number/µl = [(DNA concentration (ng/µL) X 6.022 X 10²³] / [660 X length (bp) X 109]
Using these calculations, the DNA copy number per 10-fold dilution and Cq values were determined for each gene target, and log₁₀(copy number per reaction) was plotted against the corresponding Cq values to generate the standard curve.
The standard curve exhibited strong linearity across five orders of magnitude, with a linear regression equation.
Equation 1:
Cq = m(log10 DNA copy number) + b
where:
Cq (also called Ct) is the quantification cycle in quantitative PCR (qPCR).
m is the slope
b is the intercept.
For the test samples, the log of DNA concentration was calculated from Equation 2.
Equation 2:
Log10 DNA copy number = (Cq-b)/m
Population dynamics in the microcosms.
General flux of bacteria
The general flux of bacteria in the microcosms was monitored in two ways;
a) Optical density: The optical density (at λ = 600nm) was monitored at 24-hour interval, for 120 hours using 96-well microtiter plate by an absorbance reader (AccurisTM smartreaderTM 96, model MR9600, USA). The OD600 of natural seawater was used as reference at each point.
According to manufacturer specifications for the Accuris SmartReader 96 (MR9600):
Absorbance range: 0.000 – ~4.000 OD
Photometric resolution: ~0.001 OD
Accuracy: typically ±1% (0–2.0 OD range)
Precision (repeatability): typically, <1%
All OD readings were within the detection limit
Calibration: Blank wells containing sterile culture medium/sterile water were included on each plate and used to identify baseline/background absorbance.
b) Real time quantitative polymerase chain reaction (Rt-qPCR): Rt-qPCR was used to quantify total bacteria, Roseobacter, Flavobacterium, total Vibrio species, and Vibrio parahaemolyticus at six-hour intervals. No template control (NTC) was also included in the experiment.
RT-qPCR for the genes was performed using an initial denaturation at 98 °C for 2 min, followed by 39 cycles of 98 °C for 10 s and 60 °C for 45 s. A melt curve analysis was conducted from 65 °C to 95 °C with 0.5 °C incremental increases to assess amplification specificity.
Flux of Micro-predators
The micro-predator flux was determined as follows:
a) Halobacteriovorax: The number of HBx in each microcosm vessel was measured using Rt-qPCR to monitor the numbers and population changes of HBx at 12-hour intervals using specific primers.
This RT-qPCR was performed with an initial denaturation at 94 °C for 2 min, followed by 44 cycles of 94 °C for 30 s, 55 °C for 30 s, and 72 °C for 40 s. Melt curve analysis was conducted from 65 °C to 95 °C with 0.5 °C incremental increases to confirm amplification specificity.
See supplemental file (primers_used.csv) for primer details.
b) Protists: Protists were quantified using CytoFLEX Beckman Coulter Life Sciences Headquarters, Indianapolis, IN 46268, USA (Model A00-1-1102) intervals. Specifically, protists were identified based on forward scatter (FSC) and side scatter properties, which provide consistent estimates of total abundance but do not distinguish heterotrophic protists from similarly sized detrital particles or provide taxonomic resolution. While the use of DNA-binding dyes could improve discrimination, our study focused on relative differences in total protist abundance across treatments within the same size class, for which flow cytometric-based counts are robust.
Initial gating was performed on forward scatter area (FSC-A) versus side scatter area (SSC-A) density plots to exclude background noise, electronic debris, and low-scatter particles. A sequential size-based gating strategy was then applied to separate particle populations corresponding to approximately 3 µm, 5 µm, and 10 µm diameter classes. The size of the dominant protist-associated population was identified within the gates, characterized by elevated FSC-A and SSC-A signals relative to other microbial fractions. However, the total events were counted and recorded over 120 s. Additional fluorescence channels, including PE-A and APC-A750-A, were monitored to improve event discrimination and verify population consistency.
Organism identifiers:
Taxon followed by Life Science Identifier (LSID) or DOI
Vibrio,urn:lsid:marinespecies.org:taxname:480248
Vibrio parahaemolyticus,urn:lsid:marinespecies.org:taxname:422811
Roseobacter,urn:lsid:marinespecies.org:taxname:567952